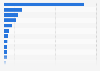
This graph depicts the percentage of each of the given demographic groups that were reached weekly by the radio in the United States in December 2015. The radio reached 95 percent of the Generation X group (ages 35 to 49) weekly in December 2015.
Weekly radio reach in the United States in December 2015, by demographic group
Basic Account
Get to know the platform
You only have access to basic statistics.
This statistic is not included in your account.
Starter Account
The ideal entry-level account for individual users
- Instant access to 1m statistics
- Download in XLS, PDF & PNG format
- Detailed references
$199 USD / Month *
Professional Account
Full access
Business Solutions including all features.
* Prices do not include sales tax.
Other statistics that may interest you Online radio in the U.S.
Overview
4
Market leaders
8
- Basic Statistic Leading online radio companies in the U.S. 2021, by active sessions
- Premium Statistic Leading iPhone music apps in the U.S. 2022, by downloads
- Premium Statistic Revenue of iHeartMedia 2023, by segment
- Basic Statistic NPR revenue in the U.S. 2015-2023
- Premium Statistic Sirius XM Holdings' revenue 2003-2023
- Premium Statistic Number of Sirius XM subscribers in the U.S. 2011-2023
- Premium Statistic Spotify revenue 2013-2023
- Premium Statistic Share of Spotify users in the U.S. 2013-2021
Consumption
8
- Premium Statistic Time spent with digital/traditional radio in the U.S. & Canada 2013-2021
- Premium Statistic Online radio reach in the U.S. 2021, by age group
- Premium Statistic Share of monthly online radio listeners in the U.S. 2007-2023
- Premium Statistic Share of weekly online radio listeners in the U.S. 2000-2023
- Premium Statistic Weekly time spent with online radio in the U.S. 2008-2021
- Premium Statistic Audio sources in cars in the U.S. 2018-2022
- Premium Statistic Listening to mobile radio in cars - penetration rate in the U.S. 2010-2022
- Premium Statistic Digital audio consumption in the U.S. and Canada in 2021, by frequency
Advertising
4
- Premium Statistic Radio station ad revenues in the U.S. 2006-2023, by type
- Premium Statistic Digital share of radio ad revenue in the U.S. 2013-2022
- Premium Statistic U.S. podcast advertising revenue in the U.S. 2015-2025
- Premium Statistic Radio local digital advertising revenue in the U.S. 2002-2023
Further related statistics
9
- Device usage among children to consume media in the United Kingdom (UK) 2013-2019
- Mobile internet use via laptops in Great Britain 2019, by demographic
- Reading frequency of book consumers in France 2017, by age
- NBC Universal's operating income 2010-2016
- U.S. cell phone owners who use mobile banking 2013, by ethnicity
- Largest Colombian-American population groups in the U.S., by county 2010
- Largest Honduran-American population groups in the U.S., by county 2010
- Media influencing final decisions about politics in the U.S. in 2011
- Married U.S. adults in 1960 and 2010
Further Content: You might find this interesting as well
Statistics
- Device usage among children to consume media in the United Kingdom (UK) 2013-2019
- Mobile internet use via laptops in Great Britain 2019, by demographic
- Reading frequency of book consumers in France 2017, by age
- NBC Universal's operating income 2010-2016
- U.S. cell phone owners who use mobile banking 2013, by ethnicity
- Largest Colombian-American population groups in the U.S., by county 2010
- Largest Honduran-American population groups in the U.S., by county 2010
- Media influencing final decisions about politics in the U.S. in 2011
- Married U.S. adults in 1960 and 2010
Nielsen. (February 6, 2016). Weekly radio reach in the United States in December 2015, by demographic group [Graph]. In Statista. Retrieved June 10, 2024, from https://www.statista.com/statistics/288940/weekly-radio-reach-in-us-by-demographic/
Nielsen. "Weekly radio reach in the United States in December 2015, by demographic group." Chart. February 6, 2016. Statista. Accessed June 10, 2024. https://www.statista.com/statistics/288940/weekly-radio-reach-in-us-by-demographic/
Nielsen. (2016). Weekly radio reach in the United States in December 2015, by demographic group. Statista. Statista Inc.. Accessed: June 10, 2024. https://www.statista.com/statistics/288940/weekly-radio-reach-in-us-by-demographic/
Nielsen. "Weekly Radio Reach in The United States in December 2015, by Demographic Group." Statista, Statista Inc., 6 Feb 2016, https://www.statista.com/statistics/288940/weekly-radio-reach-in-us-by-demographic/
Nielsen, Weekly radio reach in the United States in December 2015, by demographic group Statista, https://www.statista.com/statistics/288940/weekly-radio-reach-in-us-by-demographic/ (last visited June 10, 2024)
Weekly radio reach in the United States in December 2015, by demographic group [Graph], Nielsen, February 6, 2016. [Online]. Available: https://www.statista.com/statistics/288940/weekly-radio-reach-in-us-by-demographic/