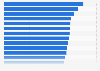
This statistic presents the growth rate in visits to retail sites based in the United States between the third quarter of 2016 and third quarter of 2018, by last-touch channel. According to the findings, the last-touch channel that experienced the highest growth rate between the two periods was social networks. In the third quarter of 2018, social networks had an increase of 110 percent in comparison to the third quarter of 2016.
Growth rate in visits to retail sites based in the United States between the 3rd quarter 2016 and 3rd quarter 2018, by last-touch channel
Basic Account
Get to know the platform
You only have access to basic statistics.
This statistic is not included in your account.
Starter Account
The ideal entry-level account for individual users
- Instant access to 1m statistics
- Download in XLS, PDF & PNG format
- Detailed references
$199 USD / Month *
Professional Account
Full access
Business Solutions including all features.
* Prices do not include sales tax.
Other statistics that may interest you Social media in Singapore
Cross-border overview
4
- Basic Statistic Global social networks ranked by number of users 2024
- Premium Statistic Number of social media user accounts APAC 2024, by country
- Premium Statistic Social media penetration rate APAC 2024, by country
- Premium Statistic Daily time spent spent using social media APAC Q1 2023, by country
Social media key facts
8
- Premium Statistic Daily hours spent on mobile Singapore 2020-2023
- Basic Statistic Number of social media users in Singapore 2018-2029
- Basic Statistic Social media penetration rate in Singapore 2019-2028
- Premium Statistic Time spent on mobile apps Singapore 2023, by category
- Premium Statistic Social network advertising audience in Singapore 2024, by platform
- Premium Statistic Market share of mobile social media platforms Singapore 2024
- Premium Statistic Average annual monthly active users for social apps Singapore 2020-2023, by category
- Premium Statistic Gender distribution social network advertising audience Singapore 2024, by platform
Facebook & Instagram
5
- Basic Statistic Number of Facebook users in Singapore 2019-2028
- Basic Statistic Facebook online reach in Singapore 2018-2027
- Premium Statistic Number of Instagram users in Singapore 2018-2024
- Premium Statistic Share of Instagram users Singapore 2023, by age and gender
- Premium Statistic Age distribution Meta advertising audience in Singapore 2024, by gender
Other social networks
5
- Premium Statistic Number of X users in Singapore 2019-2024
- Premium Statistic Number of LinkedIn users in Singapore 2019-2024
- Premium Statistic Number of Snapchat users in Singapore 2019-2024
- Premium Statistic WhatsApp users in Singapore 2020-2029
- Premium Statistic TikTok potential advertising reach in Singapore 2022-2024
User behavior
5
- Premium Statistic Daily time spent using online media in Singapore 2023, by activity
- Premium Statistic Main reasons for using social media Singapore 2023
- Premium Statistic Top ten YouTube channels in Singapore 2024, by number of views
- Premium Statistic Social apps consumer spend Singapore 2022-2023, by type
- Premium Statistic Types of items purchased using social media Singapore 2023
Further related statistics
10
- Social network usage for news access worldwide 2019-2023
- Cities with the largest share of parkland in the U.S. 2022
- Sales share of L'Oréal's global cosmetic branch 2023, by geographic zone
- Global revenue share of EssilorLuxottica in 2022, by geographical area
- Most visited amusement and theme parks in North America 2022
- Most visited Latin American amusement and theme parks 2019-2022
- Contribution of China's travel and tourism industry to GDP 2014-2023
- Global oil production share 2010-2022, by region
- Revenue of Sinopharm 2011-2022, by category
- Social network profile creation in the UK 2010-2020, by socio-economic group
Further Content: You might find this interesting as well
Statistics
- Social network usage for news access worldwide 2019-2023
- Cities with the largest share of parkland in the U.S. 2022
- Sales share of L'Oréal's global cosmetic branch 2023, by geographic zone
- Global revenue share of EssilorLuxottica in 2022, by geographical area
- Most visited amusement and theme parks in North America 2022
- Most visited Latin American amusement and theme parks 2019-2022
- Contribution of China's travel and tourism industry to GDP 2014-2023
- Global oil production share 2010-2022, by region
- Revenue of Sinopharm 2011-2022, by category
- Social network profile creation in the UK 2010-2020, by socio-economic group
eMarketer. (March 13, 2019). Growth rate in visits to retail sites based in the United States between the 3rd quarter 2016 and 3rd quarter 2018, by last-touch channel [Graph]. In Statista. Retrieved June 17, 2024, from https://www.statista.com/statistics/265813/growth-visits-based-retail-sites-last-touch-channel-usa/
eMarketer. "Growth rate in visits to retail sites based in the United States between the 3rd quarter 2016 and 3rd quarter 2018, by last-touch channel." Chart. March 13, 2019. Statista. Accessed June 17, 2024. https://www.statista.com/statistics/265813/growth-visits-based-retail-sites-last-touch-channel-usa/
eMarketer. (2019). Growth rate in visits to retail sites based in the United States between the 3rd quarter 2016 and 3rd quarter 2018, by last-touch channel. Statista. Statista Inc.. Accessed: June 17, 2024. https://www.statista.com/statistics/265813/growth-visits-based-retail-sites-last-touch-channel-usa/
eMarketer. "Growth Rate in Visits to Retail Sites Based in The United States between The 3rd Quarter 2016 and 3rd Quarter 2018, by Last-touch Channel." Statista, Statista Inc., 13 Mar 2019, https://www.statista.com/statistics/265813/growth-visits-based-retail-sites-last-touch-channel-usa/
eMarketer, Growth rate in visits to retail sites based in the United States between the 3rd quarter 2016 and 3rd quarter 2018, by last-touch channel Statista, https://www.statista.com/statistics/265813/growth-visits-based-retail-sites-last-touch-channel-usa/ (last visited June 17, 2024)
Growth rate in visits to retail sites based in the United States between the 3rd quarter 2016 and 3rd quarter 2018, by last-touch channel [Graph], eMarketer, March 13, 2019. [Online]. Available: https://www.statista.com/statistics/265813/growth-visits-based-retail-sites-last-touch-channel-usa/