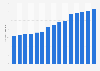
Outdoor specialty stores and E-commerce sales growth in the U.S. 2015
This statistic shows the growth of outdoor specialty stores and E-commerce sales of outdoor products in 2015 in the United States, by category. In the 12 months ending October 2015, sales of camping equipment through outdoor specialty stores and E-commerce grew by 13 percent over the previous year.