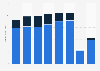
This statistic shows the annual turnover of cinemas and other motion picture projection activities in Greece from 2008 to 2014. In 2014, the sector produced a turnover of approximately 50 million euros.
Annual turnover of motion picture projection activities in Greece from 2008 to 2014 (in million euros)
Basic Account
Get to know the platform
You only have access to basic statistics.
This statistic is not included in your account.
Starter Account
The ideal entry-level account for individual users
- Instant access to 1m statistics
- Download in XLS, PDF & PNG format
- Detailed references
$199 USD / Month *
Professional Account
Full access
Business Solutions including all features.
* Prices do not include sales tax.
Other statistics that may interest you Film industry in English-speaking West-Africa
Global overview
4
Revenue
6
- Premium Statistic Box office revenue of cinemas in anglophone West Africa 2015-2022
- Premium Statistic Revenue of movies in anglophone West Africa 2019-2022, by country
- Premium Statistic Monthly box office revenue in English-speaking West-Africa 2019-2022
- Premium Statistic Nollywood, Bollywood, and Hollywood revenue in West-Africa 2022
- Premium Statistic Average movie ticket price in English-speaking West-Africa 2015-2022
- Premium Statistic Percentage change in box office revenue in Nigeria and South Africa 2020
Cinemas
6
- Premium Statistic Cinema attendance in English-speaking West Africa 2015-2022
- Premium Statistic Number of cinema sites in anglophone West Africa 2015-2022
- Premium Statistic Number of cinema screens in anglophone West Africa 2015-2022
- Premium Statistic Largest cinemas in anglophone West Africa 2022, by number of seats
- Premium Statistic Sites of major cinema chains in anglophone West Africa 2022
- Premium Statistic Screens of major cinema chains in anglophone West Africa 2022
Titles
4
Market value in Nigeria and Ghana
6
- Premium Statistic Arts, entertainment and recreation sector contribution to GDP in Nigeria 2019-2022
- Premium Statistic Financial support from Nigeria's government to Nollywood 2011-2017
- Premium Statistic Employees in the arts and entertainment sector in Ghana 2018, by business size
- Premium Statistic Employees in the arts and entertainment industry in Ghana 2018, by sector
- Premium Statistic Advertising revenue from cinema in Nigeria 2014-2018
- Premium Statistic Advertising revenue from cinema in Ghana 2014-2018
Further related statistics
9
- Comcast Corporation's net income 2006-2023
- UK console gaming reach 2015-2023, by gender
- U.S. oil and gas industry annual revenue 2010-2022
- Number of Dish Network's subscribers 2011-2022
- CBS Corporation's net income 2006-2018
- CBS Corporation's cable network revenue 2008-2018
- Consumer magazine industry revenue in North America 2008 -2016
- Magazine publishing revenue in Western Europe 2009-2016, B2B and B2C
- Magazine publishing revenue in Central & Eastern Europe 2009-2016, by B2B and B2C
Further Content: You might find this interesting as well
Statistics
- Comcast Corporation's net income 2006-2023
- UK console gaming reach 2015-2023, by gender
- U.S. oil and gas industry annual revenue 2010-2022
- Number of Dish Network's subscribers 2011-2022
- CBS Corporation's net income 2006-2018
- CBS Corporation's cable network revenue 2008-2018
- Consumer magazine industry revenue in North America 2008 -2016
- Magazine publishing revenue in Western Europe 2009-2016, B2B and B2C
- Magazine publishing revenue in Central & Eastern Europe 2009-2016, by B2B and B2C
Eurostat. (October 14, 2016). Annual turnover of motion picture projection activities in Greece from 2008 to 2014 (in million euros) [Graph]. In Statista. Retrieved June 13, 2024, from https://www.statista.com/statistics/620684/turnover-cinema-motion-picture-projection-activities-industry-in-greece/
Eurostat. "Annual turnover of motion picture projection activities in Greece from 2008 to 2014 (in million euros)." Chart. October 14, 2016. Statista. Accessed June 13, 2024. https://www.statista.com/statistics/620684/turnover-cinema-motion-picture-projection-activities-industry-in-greece/
Eurostat. (2016). Annual turnover of motion picture projection activities in Greece from 2008 to 2014 (in million euros). Statista. Statista Inc.. Accessed: June 13, 2024. https://www.statista.com/statistics/620684/turnover-cinema-motion-picture-projection-activities-industry-in-greece/
Eurostat. "Annual Turnover of Motion Picture Projection Activities in Greece from 2008 to 2014 (in Million Euros)." Statista, Statista Inc., 14 Oct 2016, https://www.statista.com/statistics/620684/turnover-cinema-motion-picture-projection-activities-industry-in-greece/
Eurostat, Annual turnover of motion picture projection activities in Greece from 2008 to 2014 (in million euros) Statista, https://www.statista.com/statistics/620684/turnover-cinema-motion-picture-projection-activities-industry-in-greece/ (last visited June 13, 2024)
Annual turnover of motion picture projection activities in Greece from 2008 to 2014 (in million euros) [Graph], Eurostat, October 14, 2016. [Online]. Available: https://www.statista.com/statistics/620684/turnover-cinema-motion-picture-projection-activities-industry-in-greece/