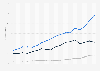
The statistic depicts the domestic shipment value of the fitness goods market in Japan from 2011 to 2019. In 2019, the fitness equipment market size was forecasted to reach approximately 18 billion Japanese yen, up from about 14 billion yen in 2011.
Domestic shipment value of the fitness equipment market in Japan from 2011 to 2019 (in billion Japanese yen)
Basic Account
Get to know the platform
You only have access to basic statistics.
This statistic is not included in your account.
Starter Account
The ideal entry-level account for individual users
- Instant access to 1m statistics
- Download in XLS, PDF & PNG format
- Detailed references
$199 USD / Month *
Professional Account
Full access
Business Solutions including all features.
* Prices do not include sales tax.
Other statistics that may interest you Sporting goods industry in Spain
Key figures
6
- Premium Statistic Sporting goods sector revenue in Spain 2014-2022
- Premium Statistic Sporting equipment import volume to Spain 2015-2022
- Premium Statistic Sporting goods manufacturers number in Spain 2015-2022
- Premium Statistic Leading sporting goods manufacturers Spain 2021
- Premium Statistic Spending on sports equipment in Spain 2015-2021
- Premium Statistic Spending on sports equipment per person in Spain 2015-2021
Leading brands and retailers
7
- Basic Statistic adidas, Nike & Puma revenue comparison 2006-2023
- Premium Statistic Number of official Nike stores by region in Spain 2023
- Premium Statistic Adidas revenue in Spain 2015-2021
- Basic Statistic La Liga: kit suppliers 2022-2023, by number of teams
- Premium Statistic Sporting goods retail enterprises number in Spain 2015-2022
- Premium Statistic Leading Spanish sporting goods retailers 2021
- Premium Statistic Decathlon revenue in Spain 2012-2021
E-commerce figures
5
- Premium Statistic Leading products and services bought online in Spain 2022
- Premium Statistic Main product categories bought in marketplaces in Spain 2021
- Premium Statistic Leading products and services bought via mobile in Spain 2022
- Premium Statistic Average online shopping expenditure in Spain 2020, by category
- Premium Statistic Sporting goods quarterly e-commerce revenue in Spain 2013-2020
International trade
5
- Premium Statistic Sports clothing and footwear import value to Spain 2015-2022
- Premium Statistic Sporting equipment import share in Spain 2022, by article
- Premium Statistic Sporting equipment export share in Spain 2022, by article
- Premium Statistic Sports clothing and footwear export value from Spain 2015-2022
- Premium Statistic Sporting equipment export value from Spain 2015-2022
Further related statistics
10
- Sporting goods industry: Net sales of Cybex by product type 2011
- The adidas Group's EBITDA worldwide 2000-2023
- Alpine ski bindings and boots retail sales in the U.S. 2010-2016
- U.S. snow sports stores snowboard boots retail inventory 2008/09-2012/13
- Revenues of VF Corporation's active segment worldwide 2016 to 2023
- Value of global chemical shipments 2001-2022
- Primary energy consumption in China 2012-2022
- Most popular sporting activities in the U.S. in 2022
- Youth participants in canoeing in the U.S. from 2006 to 2020
- Number of youth participants in fishing in the U.S. from 2006 to 2020
Further Content: You might find this interesting as well
Statistics
- Sporting goods industry: Net sales of Cybex by product type 2011
- The adidas Group's EBITDA worldwide 2000-2023
- Alpine ski bindings and boots retail sales in the U.S. 2010-2016
- U.S. snow sports stores snowboard boots retail inventory 2008/09-2012/13
- Revenues of VF Corporation's active segment worldwide 2016 to 2023
- Value of global chemical shipments 2001-2022
- Primary energy consumption in China 2012-2022
- Most popular sporting activities in the U.S. in 2022
- Youth participants in canoeing in the U.S. from 2006 to 2020
- Number of youth participants in fishing in the U.S. from 2006 to 2020
Yano Research. (June 13, 2019). Domestic shipment value of the fitness equipment market in Japan from 2011 to 2019 (in billion Japanese yen) [Graph]. In Statista. Retrieved June 17, 2024, from https://www.statista.com/statistics/693544/japan-fitness-goods-market-domestic-shipment-value/
Yano Research. "Domestic shipment value of the fitness equipment market in Japan from 2011 to 2019 (in billion Japanese yen)." Chart. June 13, 2019. Statista. Accessed June 17, 2024. https://www.statista.com/statistics/693544/japan-fitness-goods-market-domestic-shipment-value/
Yano Research. (2019). Domestic shipment value of the fitness equipment market in Japan from 2011 to 2019 (in billion Japanese yen). Statista. Statista Inc.. Accessed: June 17, 2024. https://www.statista.com/statistics/693544/japan-fitness-goods-market-domestic-shipment-value/
Yano Research. "Domestic Shipment Value of The Fitness Equipment Market in Japan from 2011 to 2019 (in Billion Japanese Yen)." Statista, Statista Inc., 13 Jun 2019, https://www.statista.com/statistics/693544/japan-fitness-goods-market-domestic-shipment-value/
Yano Research, Domestic shipment value of the fitness equipment market in Japan from 2011 to 2019 (in billion Japanese yen) Statista, https://www.statista.com/statistics/693544/japan-fitness-goods-market-domestic-shipment-value/ (last visited June 17, 2024)
Domestic shipment value of the fitness equipment market in Japan from 2011 to 2019 (in billion Japanese yen) [Graph], Yano Research, June 13, 2019. [Online]. Available: https://www.statista.com/statistics/693544/japan-fitness-goods-market-domestic-shipment-value/