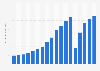
This statistic shoes the cumulative downloads of major hotel and online travel agency apps in the United States from the first quarter of 2014 to the third quarter of 2017. During that time the Airbnb app was downloaded 20 million times in the United States.
Number of downloads of major hotel and online travel agency apps in the United States from 1Q 2014 to 3Q 2017 (in millions)
Basic Account
Get to know the platform
You only have access to basic statistics.
This statistic is not included in your account.
Starter Account
The ideal entry-level account for individual users
- Instant access to 1m statistics
- Download in XLS, PDF & PNG format
- Detailed references
$199 USD / Month *
Professional Account
Full access
Business Solutions including all features.
* Prices do not include sales tax.
Other statistics that may interest you Expedia Group, Inc.
Industry overview
6
- Premium Statistic Revenue of leading OTAs worldwide 2019-2023
- Premium Statistic Marketing expenses of leading OTAs worldwide 2019-2023
- Premium Statistic Marketing/revenue ratio of leading OTAs worldwide 2019-2023
- Basic Statistic Market cap of leading online travel companies worldwide 2023
- Premium Statistic Most popular travel and tourism websites worldwide 2024
- Premium Statistic Number of aggregated downloads of leading online travel agency apps worldwide 2023
Company information
8
- Premium Statistic Revenue of Expedia Group, Inc. worldwide 2007-2023
- Premium Statistic Revenue of Expedia Group, Inc. worldwide 2019-2023, by segment
- Premium Statistic Revenue of Expedia Group, Inc. worldwide 2017-2023, by business model
- Premium Statistic Revenue of Expedia Group, Inc. in the U.S. 2010-2023
- Premium Statistic Gross bookings of Expedia Group, Inc. worldwide 2005-2023
- Premium Statistic Selling and marketing expenses of Expedia Group, Inc. worldwide 2009-2023
- Premium Statistic Operating income of Expedia Group, Inc. worldwide 2007-2023
- Premium Statistic Net income of Expedia Group, Inc. worldwide 2007-2023
U.S. consumers
8
- Premium Statistic ACSI - U.S. customer satisfaction with online travel websites as of 2024
- Basic Statistic American Customer Satisfaction Index for internet travel companies U.S. 2002-2024
- Basic Statistic ACSI - U.S. customer satisfaction with Expedia Inc. as of 2024
- Basic Statistic Most well-known travel portals in the United States 2023
- Premium Statistic Expedia brand profile in the United States 2023
- Premium Statistic Flight search engine online bookings by brand in the U.S. 2024
- Premium Statistic Hotel / private accommodation online bookings by brand in the U.S. 2024
- Premium Statistic Package holiday bookings by brand in the U.S. 2024
Further related statistics
10
- Net income of Booking Holdings worldwide 2007-2023
- Total assets of Booking Holdings worldwide 2007-2023
- Gross bookings of Booking Holdings worldwide 2015-2023, by type
- Number of bookings through Booking Holdings worldwide 2010-2023, by segment
- Revenue of Booking Holdings worldwide 2007-2023
- Private short-term rentals booked with Airbnb in New York City in 2010 and 2014
- Extended stay lodging units: total number in the U.S. 2008-2016
- Quarterly average daily rate of hotels in Indianapolis 2016-2017
- Quarterly average daily rate of hotels in New York 2016-2017
- Quarterly average daily rate of hotels in Philadelphia 2016-2017
Further Content: You might find this interesting as well
Statistics
- Net income of Booking Holdings worldwide 2007-2023
- Total assets of Booking Holdings worldwide 2007-2023
- Gross bookings of Booking Holdings worldwide 2015-2023, by type
- Number of bookings through Booking Holdings worldwide 2010-2023, by segment
- Revenue of Booking Holdings worldwide 2007-2023
- Private short-term rentals booked with Airbnb in New York City in 2010 and 2014
- Extended stay lodging units: total number in the U.S. 2008-2016
- Quarterly average daily rate of hotels in Indianapolis 2016-2017
- Quarterly average daily rate of hotels in New York 2016-2017
- Quarterly average daily rate of hotels in Philadelphia 2016-2017
Morgan Stanley. (November 10, 2017). Number of downloads of major hotel and online travel agency apps in the United States from 1Q 2014 to 3Q 2017 (in millions) [Graph]. In Statista. Retrieved June 13, 2024, from https://www.statista.com/statistics/799490/hotel-and-online-travel-agency-app-downloads-us/
Morgan Stanley. "Number of downloads of major hotel and online travel agency apps in the United States from 1Q 2014 to 3Q 2017 (in millions)." Chart. November 10, 2017. Statista. Accessed June 13, 2024. https://www.statista.com/statistics/799490/hotel-and-online-travel-agency-app-downloads-us/
Morgan Stanley. (2017). Number of downloads of major hotel and online travel agency apps in the United States from 1Q 2014 to 3Q 2017 (in millions). Statista. Statista Inc.. Accessed: June 13, 2024. https://www.statista.com/statistics/799490/hotel-and-online-travel-agency-app-downloads-us/
Morgan Stanley. "Number of Downloads of Major Hotel and Online Travel Agency Apps in The United States from 1q 2014 to 3q 2017 (in Millions)." Statista, Statista Inc., 10 Nov 2017, https://www.statista.com/statistics/799490/hotel-and-online-travel-agency-app-downloads-us/
Morgan Stanley, Number of downloads of major hotel and online travel agency apps in the United States from 1Q 2014 to 3Q 2017 (in millions) Statista, https://www.statista.com/statistics/799490/hotel-and-online-travel-agency-app-downloads-us/ (last visited June 13, 2024)
Number of downloads of major hotel and online travel agency apps in the United States from 1Q 2014 to 3Q 2017 (in millions) [Graph], Morgan Stanley, November 10, 2017. [Online]. Available: https://www.statista.com/statistics/799490/hotel-and-online-travel-agency-app-downloads-us/