Digital healthcare could be essential in improving healthcare efficiency and performance in Saudi Arabia. It has the potential to add value to the healthcare market, which exceeded four billion U.S. dollars in 2022 in Saudi Arabia and the United Arab Emirates (UAE). The nation has already taken many measures in this regard, beginning with its Vision 2030 healthcare reform in 2016 to enhance healthcare efficiency, the quality of services, and the patient experience.
Digital healthcare in Saudi Arabia - statistics & facts
Key insights
- Total digital health industry funding worldwide 2022
- 23.3bn USD

Detailed statistics
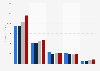
Investor funding in digital health industry 2010-2022
- Market size of AI in healthcare worldwide 2023
- 20.65bn USD

Detailed statistics
AI in healthcare market size worldwide 2021-2030
Editor’s Picks Current statistics on this topic


Further recommended statistics
-
Premium Statistic
Feelings towards use of virtual health care visits in future in the U.S. as of 2022

Feelings towards use of virtual health care visits in future in the U.S. as of 2022
Distributions of feelings towards the future use of virtual health care visits when the COVID-19 pandemic eases in the United States as of 2022
-
Premium Statistic
E-health overview in Poland 2023

E-health overview in Poland 2023
Headlines for e-health adoption and consumer spend in Poland in 2023
-
Premium Statistic
Virtual health care experience in Canada 2022

Virtual health care experience in Canada 2022
Distribution of experience with virtual health care in Canada as of 2022
-
Premium Statistic
Health spending distribution in the United States by category 2013-2022

Health spending distribution in the United States by category 2013-2022
Health spending distribution in the United States from 2013 to 2022, by category*
-
Basic Statistic
U.S. health spending per enrollee by insurance 2021 and 2022

U.S. health spending per enrollee by insurance 2021 and 2022
Health spending per enrollee in the United States in 2021 and 2022, by insurance
-
Premium Statistic
Entities use of telemedicine solutions in Poland 2022

Entities use of telemedicine solutions in Poland 2022
Does the entity use the telemedicine solutions?
-
Premium Statistic
Health entities providing access to e-services through a website in Poland 2022

Health entities providing access to e-services through a website in Poland 2022
Share of health sector entities that provide patients with access to e-services through a website in Poland in 2022
-
Premium Statistic
Ways in which consumers track health metrics using wearables in the U.S. as of 2022

Ways in which consumers track health metrics using wearables in the U.S. as of 2022
Which of the following health metrics do you use your smartwatch/fitness tracker to monitor?
-
Premium Statistic
Share of consumers open to virtual primary care worldwide 2023, by country

Share of consumers open to virtual primary care worldwide 2023, by country
Distribution of consumers' openness towards virtual primary care worldwide in 2023, by country
-
Premium Statistic
Where global telemedicine companies want to expand in the next few years 2022

Where global telemedicine companies want to expand in the next few years 2022
Share of global telemedicine companies who indicated they wanted to expand in the following regions in the next few years as of 2022
-
Premium Statistic
Share of medical specialists using telemedicine in Italy in 2022, by type

Share of medical specialists using telemedicine in Italy in 2022, by type
Percentage of medical specialists using telemedicine in Italy as of 2022, by type of usage
-
Premium Statistic
Health spending growth rate in the U.S. 2022, sorted by category

Health spending growth rate in the U.S. 2022, sorted by category
Health spending growth rate in the United States in 2022, by category
-
Premium Statistic
Medicaid spending as a percent of total U.S. health expenditure by service 2022

Medicaid spending as a percent of total U.S. health expenditure by service 2022
Medicaid expenditure as a percentage of total U.S. health expenditure in 2022, by service category*
-
Premium Statistic
Animal health leading companies by revenue 2022

Animal health leading companies by revenue 2022
Leading animal health companies in 2022, based on revenue (in billion U.S. dollars)
-
Premium Statistic
Largest health insurance companies in U.S. 2023, by membership

Largest health insurance companies in U.S. 2023, by membership
Largest health insurance companies in the U.S. in 2023, by membership (in millions)
-
Premium Statistic
Market share of top U.S. health insurance companies 2023

Market share of top U.S. health insurance companies 2023
Market share of leading health insurance companies in the United States as of 2023
-
Premium Statistic
Top 10 health care equipment and services companies by market cap 2023

Top 10 health care equipment and services companies by market cap 2023
Leading 10 health care equipment and services companies worldwide based on market capitalization as of 2023 (in billion U.S. dollars)
-
Premium Statistic
Global list of top health care equipment and service companies based on revenue 2023

Global list of top health care equipment and service companies based on revenue 2023
Ranking of the global leading 10 health care equipment and services companies based on revenue in 2023 (in billion U.S. dollars)
-
Premium Statistic
Percentage of U.S. population with health insurance 2020-2022, by coverage

Percentage of U.S. population with health insurance 2020-2022, by coverage
Percentage of the U.S. population with health insurance in 2020 and 2022, by coverage type
-
Basic Statistic
Health spending distribution in the United States by payer 2018-2021

Health spending distribution in the United States by payer 2018-2021
Health spending distribution in the United States 2018 and 2021, by payer*
-
Basic Statistic
Health costs distribution of private insurance and out-of-pocket payments U.S. 2021

Health costs distribution of private insurance and out-of-pocket payments U.S. 2021
Health spending distribution of private insurance and out-of-pocket payments in the United States in 2021
-
Basic Statistic
CVS Health's number of stores 2005-2023

CVS Health's number of stores 2005-2023
CVS Health's number of stores from 2005 to 2023
-
Premium Statistic
CVS Health's revenue 2005-2023

CVS Health's revenue 2005-2023
CVS Health's revenue from 2005 to 2023 (in million U.S. dollars)
-
Basic Statistic
CVS Health's revenue 2010-2023 by segment

CVS Health's revenue 2010-2023 by segment
CVS Health's revenue from 2010 to 2023, by segment (in billion U.S. dollars)
-
Premium Statistic
CVS Health's revenue distribution 2016-2023 by product group

CVS Health's revenue distribution 2016-2023 by product group
CVS Health's revenue distribution from 2016 to 2023, by product group
-
Premium Statistic
Top ways health businesses would use Apple Vision Pro for marketing France 2024

Top ways health businesses would use Apple Vision Pro for marketing France 2024
Leading ways health businesses would use Apple Vision Pro for marketing in France as of February 2024
-
Premium Statistic
Top ways health businesses would use Apple Vision Pro for marketing Spain 2024

Top ways health businesses would use Apple Vision Pro for marketing Spain 2024
Leading ways health businesses would use Apple Vision Pro for marketing in Spain as of February 2024
-
Basic Statistic
Bausch Health revenue by segment 2021-2023
Bausch Health revenue by segment 2021-2023
Revenue of Bausch Health Companies from 2021 to 2023, by segment (in million U.S. dollars)
-
Premium Statistic
Revenue of Bausch Health 2011-2023

Revenue of Bausch Health 2011-2023
Revenue of Bausch Health Companies from 2011 to 2023 (in million U.S. dollars)
-
Premium Statistic
Health foods market size in Japan FY 2015-2024

Health foods market size in Japan FY 2015-2024
Shipment value of the health foods market in Japan in fiscal years 2015 to 2023 with a forecast for 2024 (in billion Japanese yen)
-
Basic Statistic
Health insurance: Consumer price index (CPI) annually in the UK 2003-2023

Health insurance: Consumer price index (CPI) annually in the UK 2003-2023
Consumer price index (CPI) of health insurance annually in the United Kingdom (UK) from 2003 to 2023*
-
Premium Statistic
Sales revenue of LG Household & Health Care 2014-2023

Sales revenue of LG Household & Health Care 2014-2023
Consolidated sales revenue of LG Household & Health Care from 2014 to 2023 (in trillion South Korean won)
-
Premium Statistic
10 most expensive U.S. states for home health aide services 2023

10 most expensive U.S. states for home health aide services 2023
Top 10 U.S. states with highest annual cost for in-home care home health aide services in 2023 (in U.S. dollars)
-
Premium Statistic
R&D expenses of LG Household & Health Care 2017-2023

R&D expenses of LG Household & Health Care 2017-2023
Research and development expenses of LG Household & Health Care from 2017 to 2023 (in billion South Korean won)
-
Premium Statistic
Spending on voluntary health insurance in Italy 2010-2022

Spending on voluntary health insurance in Italy 2010-2022
Voluntary health insurance schemes spending in Italy from 2010 to 2022 (in million euros)
-
Premium Statistic
Number of community health workers employed by U.S. state 2023

Number of community health workers employed by U.S. state 2023
Number of community health workers employed in the United States in 2023, by state
-
Premium Statistic
GDP of the health sector in Mexico 2010-2021

GDP of the health sector in Mexico 2010-2021
Gross domestic product of the health sector in Mexico from 2010 to 2021 (in million Mexican pesos)
-
Premium Statistic
Number of mental health/substance abuse social workers employed by U.S. state 2023

Number of mental health/substance abuse social workers employed by U.S. state 2023
Number of mental health and substance abuse social workers employed in the United States in 2023, by state
-
Premium Statistic
States ranking for women's health care and safety in the U.S. in 2024

States ranking for women's health care and safety in the U.S. in 2024
Ranking of states from best to worst for women's health care and safety in the United States in 2024
-
Premium Statistic
Share of health expenditure spent on voluntary health insurance in Italy 2010-2022

Share of health expenditure spent on voluntary health insurance in Italy 2010-2022
Voluntary health insurance schemes as a share of current health expenditure in Italy from 2010 to 2022
-
Basic Statistic
U.S. health expenditure as percent of GDP 1960-2022

U.S. health expenditure as percent of GDP 1960-2022
U.S. national health expenditure as percent of GDP from 1960 to 2022
-
Premium Statistic
Per capita health expenditure in selected countries 2022

Per capita health expenditure in selected countries 2022
Per capita health expenditure in selected countries in 2022 (in U.S. dollars)
-
Basic Statistic
Public and private per capita health expenditure in selected countries 2022

Public and private per capita health expenditure in selected countries 2022
Public and private per capita health expenditure in selected countries in 2022 (in U.S. dollars)
-
Premium Statistic
Provincial governmental health spending per capita in Canada 2023, by province

Provincial governmental health spending per capita in Canada 2023, by province
Provincial/territorial government sector health expenditure per capita in Canada in 2023, by province (in Canadian dollars)
-
Premium Statistic
U.S. national health expenditure per capita 1960-2022

U.S. national health expenditure per capita 1960-2022
National per capita health expenditure in the United States from 1960 to 2022 (in U.S. dollars)
-
Basic Statistic
Number of people in the U.S. without health insurance 1997-2022

Number of people in the U.S. without health insurance 1997-2022
Number of people without health insurance in the United States from 1997 to 2022 (in millions)
-
Premium Statistic
U.S. health care expenditure distribution by payer 2015-2023

U.S. health care expenditure distribution by payer 2015-2023
Distribution of U.S. health care expenditure from 2015 to 2023, by payer
-
Premium Statistic
U.S. Americans with health insurance 1990-2022

U.S. Americans with health insurance 1990-2022
Number of people with health insurance in the United States from 1990 to 2022 (in millions)
-
Premium Statistic
Total health spending per capita in Canada 1975-2023

Total health spending per capita in Canada 1975-2023
Total health expenditure per capita in Canada from 1975 to 2023 (in Canadian dollars)
-
Premium Statistic
Percentage of U.S. Americans with any health insurance 1990-2022

Percentage of U.S. Americans with any health insurance 1990-2022
Percentage of people with any health insurance in the United States from 1990 to 2022
Further reports
Get the best reports to understand your industry


Contact
Get in touch with us. We are happy to help.


Meredith Alda
Sales Manager– Contact (United States)
Mon - Fri, 9am - 6pm (EST)
Yolanda Mega
Operations Manager– Contact (Asia)
Mon - Fri, 9am - 5pm (SGT)
Kisara Mizuno
Senior Business Development Manager– Contact (Asia)
Mon - Fri, 10:00am - 6:00pm (JST)
Lodovica Biagi
Director of Operations– Contact (Europe)
Mon - Fri, 9:30am - 5pm (GMT)
Carolina Dulin
Group Director - LATAM– Contact (Latin America)
Mon - Fri, 9am - 6pm (EST)