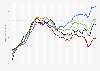
Revenue in the accessories market Worldwide 2018-2028
The global revenue in the accessories market was forecast to continuously increase between 2024 and 2028 by in total 89.4 billion U.S. dollars (+15.46 percent). After the sixth consecutive increasing year, the indicator is estimated to reach 667.72 billion U.S. dollars and therefore a new peak in 2028.
The Statista Market Insights cover a broad range of additional markets.
The Statista Market Insights cover a broad range of additional markets.