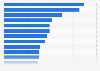
In 2022, companies supporting creators in distributing and monetizing their content via selling of their merchandising made up almost 73 percent of the average paid monthly ad spend in the sector. Companies supporting creators with distributing their courses made up a share of over 11 percent in monthly paid ad spend, while companies for community management made up almost a five percent share of the average ad spending in the category.
Distribution of average paid monthly advertising spending of companies supporting the creator economy worldwide in 2022, by service
Basic Account
Get to know the platform
You only have access to basic statistics.
This statistic is not included in your account.
Starter Account
The ideal entry-level account for individual users
- Instant access to 1m statistics
- Download in XLS, PDF & PNG format
- Detailed references
$199 USD / Month *
Professional Account
Full access
Business Solutions including all features.
* Prices do not include sales tax.
Other statistics that may interest you User-generated content
Overview
6
- Basic Statistic Worldwide digital population 2024
- Premium Statistic Number of global social network users 2017-2028
- Premium Statistic Global social network penetration 2019-2028
- Premium Statistic Most used social media platforms by type in the U.S. 2023
- Premium Statistic Most common social media activities in the U.S. 2024
- Basic Statistic Media usage in an online minute 2023
Online conversations
8
- Basic Statistic Highest trending global topics on social media 2022
- Basic Statistic Facebook and Instagram: global sustainability conversation trends 2022-2023
- Basic Statistic Facebook and Instagram: global internet and technology conversation trends 2022-2023
- Basic Statistic Facebook and Instagram: cultural conversation trends 2022-2023
- Basic Statistic Facebook and Instagram: beauty and body positive conversation trends 2022-2023
- Premium Statistic Discord: most popular servers for global users 2024, by number of members
- Basic Statistic Discord: most popular gaming servers for global users 2024, by number of members
- Premium Statistic Reddit: leading AMAs by number of upvotes 2022
Video
7
- Basic Statistic Most liked TikTok videos of all time 2023
- Premium Statistic TikTok: number of views per video 2023, by account type
- Premium Statistic TikTok: most viewed European cities 2023, by number of views per inhabitant
- Premium Statistic TikTok: most viewed European cities 2023, by number of views
- Basic Statistic TikTok: distribution of videos removed worldwide Q1 2023, by reason
- Premium Statistic Hours of video uploaded to YouTube every minute 2007-2022
- Basic Statistic YouTube Shorts: global logged in monthly users 2022-2023
Gaming video content (GVC)
5
- Premium Statistic Active streamers on Twitch worldwide 2024
- Premium Statistic Total hours watched of most popular streamers on Twitch 2024
- Premium Statistic Number of minutes spent watching Twitch content worldwide 2012-2023
- Premium Statistic YouTube: most subscribed gaming channels 2024
- Basic Statistic Leading YouTube Gaming streamers 2024, based on hours watched
Photos and selfies
8
- Basic Statistic Selected social video and photo app global downloads 2020-2023
- Basic Statistic Most downloaded photo and video editor apps in the U.S. 2023
- Basic Statistic Instagram accounts with the most followers worldwide 2024
- Basic Statistic Instagram: most popular posts as of 2024
- Basic Statistic Instagram: favorite types of posts for global users 2023
- Premium Statistic U.S. BeReal users opinion on the app authenticity 2022
- Basic Statistic U.S. adults: number of photographs online 2022
- Premium Statistic UK: online footprint of social network users 2022
Online reviews
8
- Premium Statistic Sources of information about products in the U.S. 2024
- Premium Statistic Attitudes towards online shopping in the U.S. 2024
- Premium Statistic Sources of inspiration for new products in the U.S. 2024
- Premium Statistic Frequency of reading local businesses online reviews in the U.S. 2023
- Premium Statistic Number of user reviews and ratings on Tripadvisor worldwide 2014-2023
- Premium Statistic Number of reviews of best-selling beauty & personal care products on Amazon 2023
- Premium Statistic Online beauty shoppers who read reviews in the U.S. 2023
- Premium Statistic Most helpful webpage product details when shopping for beauty online in the U.S. 2023
Further related statistics
8
- Breakdown of U.S. online ad revenue 2023, by format
- Netflix's streaming content obligations 2010-2023, by type
- Social network profile creation in the UK 2010-2020, by socio-economic group
- Change in B2C content marketing budgets North America 2020
- Average time spent with magazines in North America in 2018, by format
- Sponsorship spending in North America 2007-2018
- Sponsorship spending worldwide 2007-2018
- Magazine publishing revenue in Central & Eastern Europe 2009-2016, by B2B and B2C
Further Content: You might find this interesting as well
Statistics
- Breakdown of U.S. online ad revenue 2023, by format
- Netflix's streaming content obligations 2010-2023, by type
- Social network profile creation in the UK 2010-2020, by socio-economic group
- Change in B2C content marketing budgets North America 2020
- Average time spent with magazines in North America in 2018, by format
- Sponsorship spending in North America 2007-2018
- Sponsorship spending worldwide 2007-2018
- Magazine publishing revenue in Central & Eastern Europe 2009-2016, by B2B and B2C
NeoReach. (December 21, 2022). Distribution of average paid monthly advertising spending of companies supporting the creator economy worldwide in 2022, by service [Graph]. In Statista. Retrieved June 16, 2024, from https://www.statista.com/statistics/1357914/pais-monthly-ad-spend-creator-economy-companies-by-service/
NeoReach. "Distribution of average paid monthly advertising spending of companies supporting the creator economy worldwide in 2022, by service." Chart. December 21, 2022. Statista. Accessed June 16, 2024. https://www.statista.com/statistics/1357914/pais-monthly-ad-spend-creator-economy-companies-by-service/
NeoReach. (2022). Distribution of average paid monthly advertising spending of companies supporting the creator economy worldwide in 2022, by service. Statista. Statista Inc.. Accessed: June 16, 2024. https://www.statista.com/statistics/1357914/pais-monthly-ad-spend-creator-economy-companies-by-service/
NeoReach. "Distribution of Average Paid Monthly Advertising Spending of Companies Supporting The Creator Economy Worldwide in 2022, by Service." Statista, Statista Inc., 21 Dec 2022, https://www.statista.com/statistics/1357914/pais-monthly-ad-spend-creator-economy-companies-by-service/
NeoReach, Distribution of average paid monthly advertising spending of companies supporting the creator economy worldwide in 2022, by service Statista, https://www.statista.com/statistics/1357914/pais-monthly-ad-spend-creator-economy-companies-by-service/ (last visited June 16, 2024)
Distribution of average paid monthly advertising spending of companies supporting the creator economy worldwide in 2022, by service [Graph], NeoReach, December 21, 2022. [Online]. Available: https://www.statista.com/statistics/1357914/pais-monthly-ad-spend-creator-economy-companies-by-service/