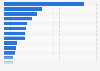
In June 2019, consumers using spent over 80 minutes using the free and paid Pandora Radio music app respectively, suggesting that users of the service are more receptive to ad-supported free versions than users of other music platforms. Users of Spotify, SoundCloud, and iHeartRadio were more inclined to spend longer using the paid subscription service, and Spotify users spent almost 2.5 hours per visit using the paid mobile app.
Time spent on selected music streaming services in the United States as of June 2019 (in minutes)
Basic Account
Get to know the platform
You only have access to basic statistics.
This statistic is not included in your account.
Starter Account
The ideal entry-level account for individual users
- Instant access to 1m statistics
- Download in XLS, PDF & PNG format
- Detailed references
$199 USD / Month *
Professional Account
Full access
Business Solutions including all features.
* Prices do not include sales tax.
Other statistics that may interest you Statistics on
About the industry
10
- Basic Statistic Average session duration of streaming services in the U.S. 2018
- Basic Statistic Most popular music streaming services in the U.S. 2018, by number of smartphone users
- Basic Statistic Most popular paid music streaming services in the U.S. 2019, by mobile app reach
- Basic Statistic Leading U.S. music streaming services 2019, by mobile reach
- Basic Statistic Most popular music streaming services in the U.S. 2018-2019, by audience
- Basic Statistic Most popular music streaming services U.S. 2018, by number of mobile only users
- Basic Statistic Popular music streaming services in the U.S. 2018, by sessions per user per month
- Premium Statistic Latin America: leading music streaming providers 2017
- Basic Statistic Most popular music streaming services in the U.S. 2018, by number of computer users
- Basic Statistic Apple Music users in the U.S. 2018, by age
About the region
9
- Basic Statistic Apple Music users in the U.S. 2018, by gender
- Premium Statistic Weekly music streaming or download services usage in the U.S. 2019-2020
- Basic Statistic Opinion on amount of music streaming service options in the U.S. 2019
- Premium Statistic Most popular music streaming services in the U.S. 2017
- Premium Statistic Most popular paid audio streaming services in the U.S. 2017, by age
- Premium Statistic Music listening sources in the U.S. 2016
- Premium Statistic Digital audio purchases by brand in the U.S. 2024
- Basic Statistic Most popular entertainment apps in the U.S. 2019, by audience
- Premium Statistic Share of audio song streams in the U.S. 2018, by release period
Selected statistics
1
Other regions
10
- Premium Statistic Digital audio purchases by brand in Italy 2024
- Premium Statistic Leading music and apps in Google Play in Austria 2021, by downloads
- Premium Statistic Most downloaded music streaming apps in Poland 2023
- Premium Statistic Latin America: number of online music subscribers 2014-2017
- Premium Statistic Mexico: smartphone music use 2016-2019
- Premium Statistic Most used music and radio streaming services in the UK Q1 2020
- Premium Statistic Most used digital music services pre- and post- the COVID-19 lockdown in Denmark 2020
- Premium Statistic Leading music apps in Google Play in Spain 2020, by downloads
- Premium Statistic Leading music apps in Google Play in Switzerland 2021, by downloads
- Premium Statistic Leading music apps in Google Play in France 2018, by downloads
Related statistics
10
- Premium Statistic Individuals downloading/streaming music per day in Sweden 2009-2022 by gender
- Premium Statistic Individuals downloading/streaming music per day in Sweden 2009-2022 by age group
- Basic Statistic Most used digital music services in Sweden 2022
- Basic Statistic Most used digital music services in Norway 2022
- Premium Statistic Individuals streaming audio files on an average day in Norway 2021, by age
- Premium Statistic Leading music apps in Google Play in Germany 2021, by downloads
- Premium Statistic Leading music apps in Google Play in Italy 2021, by downloads
- Premium Statistic Most used digital music services pre- and post- the COVID-19 lockdown in Norway 2020
- Premium Statistic Most used digital music services pre- and post- the COVID-19 lockdown in Sweden 2020
- Premium Statistic Important factors when listening to online music in Norway 2020
Further related statistics
10
- U.S. cell phone owners who use mobile banking 2013, by ethnicity
- Survey: ownership of mobile devices by U.S. American adults 2011-2012
- Service revenue of the U.S. mobile wireless industry 1985-2021
- Number of China Unicom mobile subscriptions 2012-2022
- Device usage among children to consume media in the United Kingdom (UK) 2013-2019
- Internet usage on a mobile phone in Great Britain 2010-2019, by age
- Apple iPhone sales worldwide 2007-2023
- Podcast consumption on mobile in the U.S. 2017
- Device preference for internet browsing in the United Kingdom (UK) 2015, by age
- Use of smartphones by shoppers in retail stores in Italy in 2015
Further Content: You might find this interesting as well
Statistics
- U.S. cell phone owners who use mobile banking 2013, by ethnicity
- Survey: ownership of mobile devices by U.S. American adults 2011-2012
- Service revenue of the U.S. mobile wireless industry 1985-2021
- Number of China Unicom mobile subscriptions 2012-2022
- Device usage among children to consume media in the United Kingdom (UK) 2013-2019
- Internet usage on a mobile phone in Great Britain 2010-2019, by age
- Apple iPhone sales worldwide 2007-2023
- Podcast consumption on mobile in the U.S. 2017
- Device preference for internet browsing in the United Kingdom (UK) 2015, by age
- Use of smartphones by shoppers in retail stores in Italy in 2015
comScore. (December 16, 2019). Time spent on selected music streaming services in the United States as of June 2019 (in minutes) [Graph]. In Statista. Retrieved June 02, 2024, from https://www.statista.com/statistics/822902/most-popular-us-music-streaming-services-monthly-time/
comScore. "Time spent on selected music streaming services in the United States as of June 2019 (in minutes)." Chart. December 16, 2019. Statista. Accessed June 02, 2024. https://www.statista.com/statistics/822902/most-popular-us-music-streaming-services-monthly-time/
comScore. (2019). Time spent on selected music streaming services in the United States as of June 2019 (in minutes). Statista. Statista Inc.. Accessed: June 02, 2024. https://www.statista.com/statistics/822902/most-popular-us-music-streaming-services-monthly-time/
comScore. "Time Spent on Selected Music Streaming Services in The United States as of June 2019 (in Minutes)." Statista, Statista Inc., 16 Dec 2019, https://www.statista.com/statistics/822902/most-popular-us-music-streaming-services-monthly-time/
comScore, Time spent on selected music streaming services in the United States as of June 2019 (in minutes) Statista, https://www.statista.com/statistics/822902/most-popular-us-music-streaming-services-monthly-time/ (last visited June 02, 2024)
Time spent on selected music streaming services in the United States as of June 2019 (in minutes) [Graph], comScore, December 16, 2019. [Online]. Available: https://www.statista.com/statistics/822902/most-popular-us-music-streaming-services-monthly-time/