
Manya Rathore
Research expert covering India

Detailed statistics
Number of operational SEZs India 2022, by state

Detailed statistics
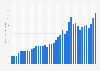
Value of exports from SEZs in India FY 2009-2022

Detailed statistics
Value of export of goods and services from SEZs India FY 2022- FY 2023

Leading SEZs in India FY 2023, by services exports
Leading Special Economic Zones (SEZs) in India during the financial year 2023 (in billion U.S. dollars), by services exports

Goods exports value from SEZs India FY 2023, by destination
Value of goods exports from Special Economic Zones (SEZs) in India during the financial year 2023, by destination (in billion U.S. dollars)

Leading SEZs in India FY 2023, by goods exports
Leading Special Economic Zones (SEZs) in India during the financial year 2023 (in billion U.S. dollars), by goods exports

Goods exports from SEZs in India FY 2023, by key zones
Value of export goods from Special Economic Zones (SEZs) during financial year 2023, by key zones (in billion U.S. dollars)

Leading SEZs in India FY 2023, by goods imports
Leading Special Economic Zones (SEZs) in India during the financial year 2023 (in billion U.S. dollars), by goods imports

Services exports from SEZs in India FY 2023, by key zones
Value of exports of services from Special Economic Zones (SEZs) during financial year 2023, by key zones (in billion U.S. dollars)
Value of export of goods and services from SEZs India FY 2022- FY 2023
Value of export of goods and services from Special Economic Zones (SEZs) in India between financial years 2022 and 2023 (in billion U.S. dollars)

Investments in SEZs in India 2022
Investments in Special Economic Zones (SEZs) in India as of December 2022 (in billion Indian rupees)

Services exports value from SEZs India FY 2023, by destination
Value of services exports from Special Economic Zones (SEZs) in India during the financial year 2023, by destination (in billion U.S. dollars)

Number of special economic zones (SEZs) in Africa 2020, by leading country
Number of special economic zones (SEZs) in Africa in 2020, by leading country

Commodity sales value in Shanghai free trade zone 2015-2022
Sales value of commodities in China pilot free-trade zone in Shanghai from 2015 to 2022 (in trillion yuan)

Investment value on fixed assets in Shanghai free trade zone 2015-2022
Total value of fixed asset investment in China pilot free-trade zone in Shanghai from 2015 to 2022 (in billion yuan)

Actual FDI value in Shanghai free trade zone 2015-2022
Value of foreign direct investment in actual use in China pilot free-trade zone in Shanghai from 2015 to 2022 (in billion U.S. dollars)
Value of exports from SEZs in India FY 2009-2022
Value of exports from Special Economic Zones (SEZs) in India between financial year 2009 and 2022 (in billion Indian rupees)

U.S. exports of trade goods 2023 by product industry class
Volume of exports of trade goods in the United States in 2023, by product industry class (NAICS) (in billion U.S. dollars)

Change in U.S. exports of trade goods 1990-2023
Percentage of change in volume of U.S. exports of trade goods from 1990 to 2023

U.S. exports of trade goods to China 1985-2023
Volume of U.S. exports of trade goods to China from 1985 to 2023 (in billion U.S. dollars)

U.S. exports of trade goods, by state 2023
Volume of U.S. exports of trade goods in 2023, by state (in million U.S. dollars)

U.S. foreign trade - exports of trade goods and services by quarter 2010-2023
Total volume of U.S. exports of trade goods and services from 2010 to 2023, by quarter (in billion U.S. dollars)

Land size of economic zones under development of DP World in 2021, by zone
Land size of economic zones under development of DP World in 2021, by zone (in hectares)

EU International Trade: share of intra- and extra-EU exports in total 2002-2023
Annual share of goods exports from the European Union going to intra-EU and extra-EU trade partners from 2002 to 2023

U.S. exports of trade goods to the world 1987-2023
Total volume of U.S. exports of trade goods from 1987 to 2023 (in billion U.S. dollars)

Land size of operational economic zones of DP World worldwide in 2021, by zone
Land size of operational economic zones of DP World worldwide as of 2021, by zone (in hectares)

EU Internal Trade: total intra-EU goods exports 1999-2023, by member state
Total annual goods exports by European Union member states to other countries within the EU from 1999 to 2023 (in trillions of Euros)

U.S. exports of trade goods 2023, by end-use commodity category
Volume of exports of trade goods in the United States in 2023, by principal end-use commodity category (in billion U.S. dollars)

Contribution level of manufacturing to economic growth South Korea 1954-2022
Contribution rate of the manufacturing industry to economic growth in South Korea from 1954 to 2022

EU Internal Trade: trade balance for manufactured goods 2023, by member state
Annual trade balance for manufactured goods* within the European Union in 2023, by member state (in millions of Euros)

Free trade agreements with South Korea 2023
Effectuated free trade agreements with South Korea as of December 2023

South Korean export share in world exports 2013-2021
Share of exports from South Korea in total world exports from 2013 to 2021

Austria: motor vehicle exports to leading trade partners 2022
Value of motor vehicle exports from Austria in 2022, by leading trade partners (in million euros)

Economic impact of 5G on manufacturing sector in India 2023-2040, by spectrum
Estimated economic impact of 5G on manufacturing sector in India between 2023 and 2040, by spectrum (in billion U.S. dollars)

EU share of world exports and imports 2002-2023
Annual share of world goods imports and exports of the European Union from 2002 to 2023

Growth rate of exports of trade goods in Italy 2023, by industry
Growth rate of Italian exports of trade goods in September 2023, by industry

U.S. share of adults who think free trade is good for the country 2021, by party
Share of people in the United States who think free trade agreements is good for the country in 2021, by political ideology

U.S. exports of trade goods to Russia 1992-2023
Volume of U.S. exports of trade goods to Russia from 1992 to 2023 (in billion U.S. dollars)

U.S. exports of trade goods to Africa 1997-2023
Volume of U.S. exports of trade goods to Africa from 1997 to 2023 (in billion U.S. dollars)

U.S. exports of trade goods to India 1985-2023
Volume of U.S. exports of trade goods to India from 1985 to 2023 (in billion U.S. dollars)

U.S. exports of trade goods to Japan 1985-2023
Volume of U.S. exports of trade goods to Japan from 1985 to 2023 (in billion U.S. dollars)

U.S. exports of trade goods to Germany 1985-2023
Volume of U.S. exports of trade goods to Germany from 1985 to 2023 (in billion U.S. dollars)

U.S. exports of trade goods to Mexico 1985-2023
Volume of U.S. exports of trade goods to Mexico from 1985 to 2023 (in billion U.S. dollars)

U.S. exports of trade goods to Nigeria 1985-2023
Volume of U.S. exports of trade goods to Nigeria from 1985 to 2023 (in million U.S. dollars)

U.S. exports of trade goods to Saudi Arabia 1985-2023
Volume of U.S. exports of trade goods to Saudi Arabia from 1985 to 2023 (in billion U.S. dollars)
U.S. exports of trade goods to Australia 1985-2023
Volume of U.S. exports of trade goods to Australia from 1985 to 2023 (in billion U.S. dollars)

U.S. exports of trade goods to Thailand 1985-2023
Volume of U.S. exports of trade goods to Thailand from 1985 to 2023 (in billion U.S. dollars)

U.S. exports of trade goods to North America 1985-2023
Volume of U.S. exports of trade goods to North America from 1985 to 2023 (in billion U.S. dollars)

U.S. exports of trade goods to South Korea 1985-2023
Volume of U.S. exports of trade goods to South Korea from 1985 to 2023 (in billion U.S. dollars)

U.S. exports of trade goods to Canada 1985-2023
Volume of U.S. exports of trade goods to Canada from 1985 to 2023 (in billion U.S. dollars)

U.S. exports of trade goods to Israel 1985-2023
Volume of U.S. exports of trade goods to Israel from 1985 to 2023 (in billion U.S. dollars)

U.S. exports of trade goods to Malaysia 1985-2023
Volume of U.S. exports of trade goods to Malaysia from 1985 to 2023 (in billion U.S. dollars)

U.S. exports of trade goods to Hong Kong 1985-2023
Volume of U.S. exports of trade goods to Hong Kong from 1985 to 2023 (in billion U.S. dollars)


Mon - Fri, 9am - 6pm (EST)
Mon - Fri, 9am - 5pm (SGT)
Mon - Fri, 10:00am - 6:00pm (JST)
Mon - Fri, 9:30am - 5pm (GMT)
Mon - Fri, 9am - 6pm (EST)


