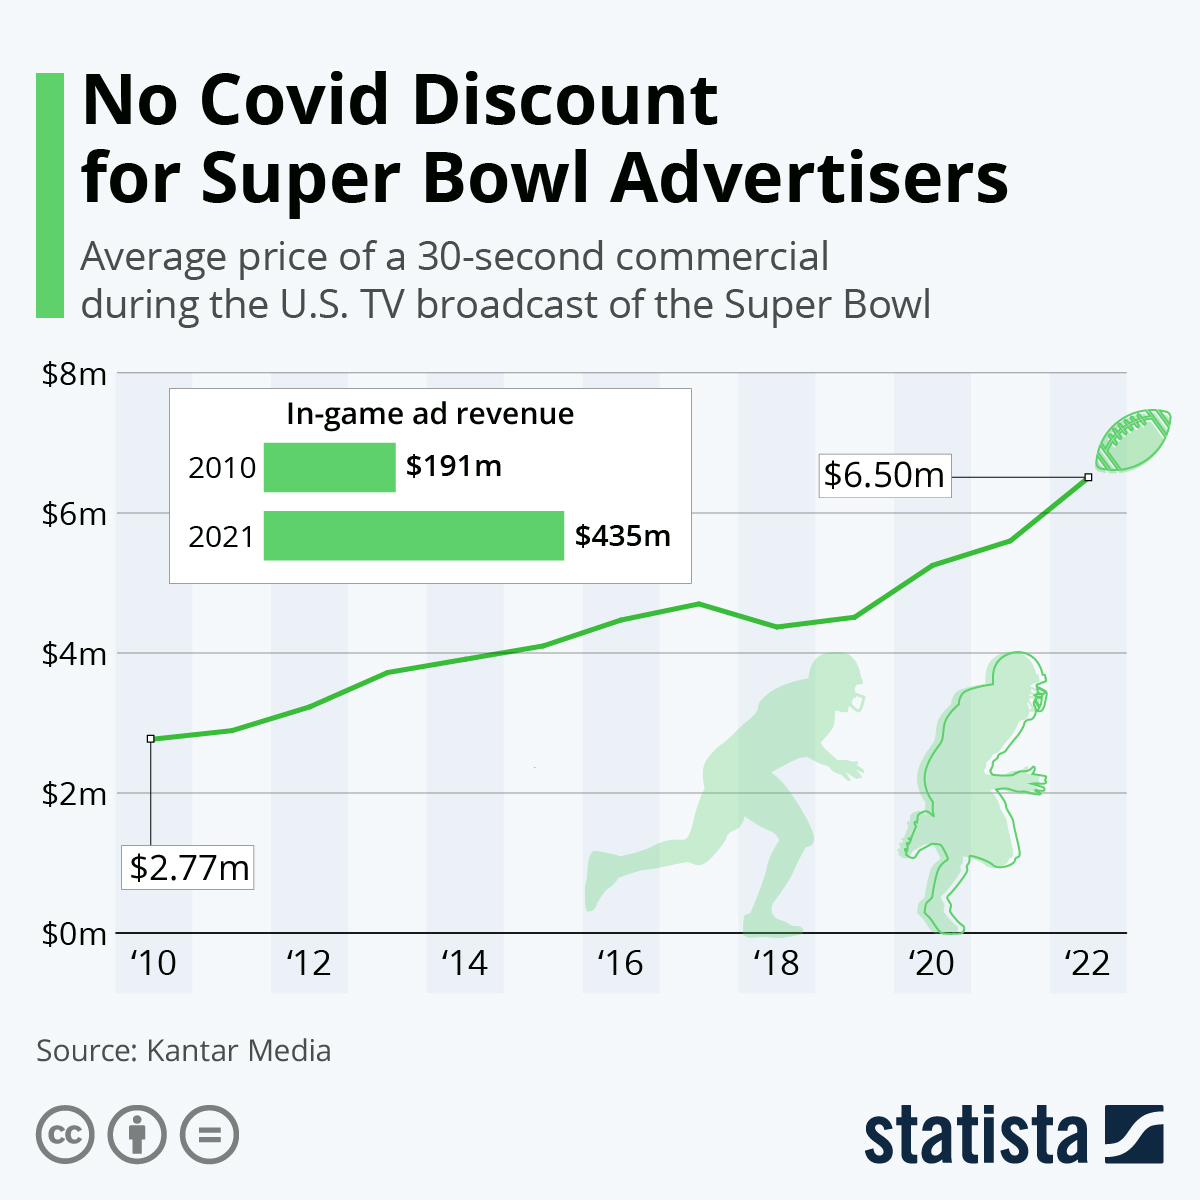
When Super Bowl LVI kicks off on February 13, the NFL championship won’t be the only title that’s on the line. With roughly a hundred million viewers glued to the TV in the U.S. alone, some of the world's biggest and most popular brands will be competing for the unofficial title of “Most Memorable Super Bowl Ad”.
Since 2010, the average rate for a 30-second spot during the Super Bowl broadcast has risen from $2.77 million to $6.50 million, making it by far the most expensive time slot U.S. television has to offer – a 30-second spot during the Academy Award ceremony is less than half the price. It's a price that brands are willing to pay though. Last year, in-game ad revenue amounted to $435 million. According to Kantar Media that is roughly equivalent to the combined ad revenue of the four major U.S. broadcast networks in an average week.
In return for their investment, brands not only get a huge audience (91.6 million viewers in 2021) but an audience that sticks around: during the 2013 Super Bowl, only 0.7 percent of the audience tuned away during commercial breaks. The average tuneaway rate during regular TV programming is five times as high. Consumers tend to pay special attention to Super Bowl ads, as agencies typically try to honour the prestigious occasion with especially witty and often funny ads. In recent years, the dawn of YouTube has added another bonus for Super Bowl advertisers seeing that the most popular ads often reach millions of additional viewers on the platform.