German  |  English
Facebook Drives More E-Commerce Traffic Than Pinterest
 

Facebook Drives More E-Commerce Traffic Than Pinterest

by Felix Richter, 08.10.2012

This chart shows key metrics of social media channels as a source of e-commerce traffic. The averages are based on data from 689 million shopping sessions that took place in the United States between January and August 2012.

The question has been asked many times: is Facebook of any value to online retailers? According to data recently released by RichRelevance, it is.

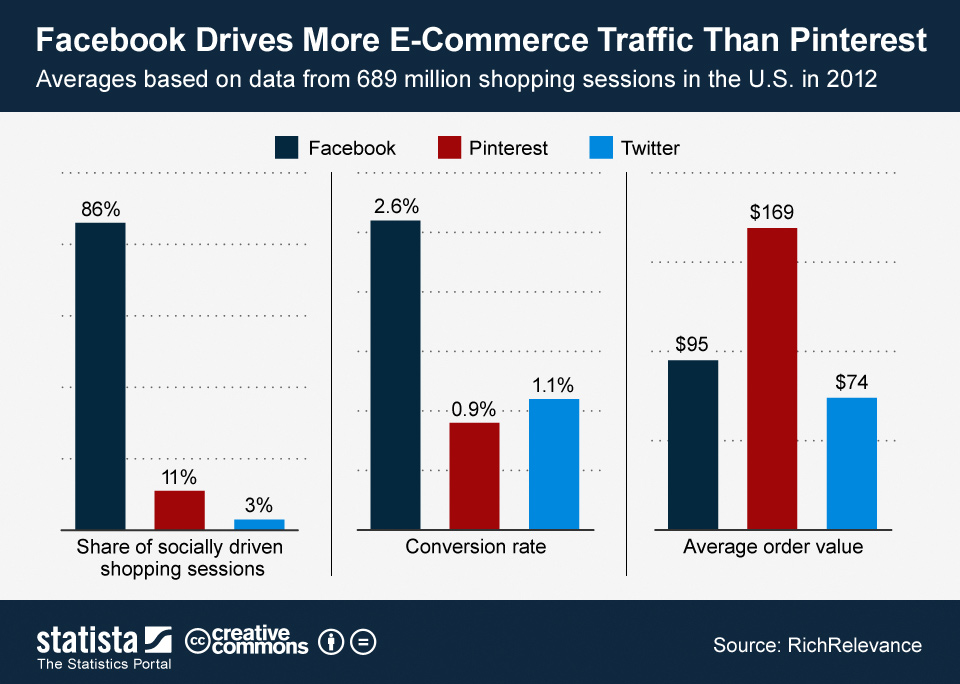
The e-commerce specialist analyzed 689 million shopping sessions between January and August with a special focus on sessions that were initiated through social channels. Not surprisingly given its large user base, Facebook drives significantly more traffic to retail sites than Pinterest and Twitter do: the world’s largest social network accounted for 86 percent of all shopping sessions that started off on any of the three sites.

What’s more interesting is the fact that shoppers coming from Facebook are more than twice as likely to make a purchase as those coming from Pinterest, a site much more visual appealing and product-focused than Facebook is. In terms of average order value, Pinterest is far ahead of its peers, which is possibly attributable to the fact that Pinterest has a design-conscious high income user base.

Show more statistics on the topic:
Newsletter
 

Yes, please send me a daily reminder for the 'Chart of the Day':

Contact
 
Felix Richter
Felix Richter
Media Relations Manager felix.richter@statista.com

+1 (212) 960 8349
Google+
Download & Reference
 

Download JPG Download Chart
URL to be used as reference link:

FAQ
 

Who may use the "Chart of the Day"?
The Statista "Chart of the Day", made available under the Creative Commons License CC BY-ND 3.0, may be used and displayed without charge by all commercial and non-commercial websites. Use is, however, only permitted with the inclusion of the Statista reference link provided alongside the Chart of the Day.

Which topics are covered by the "Chart of the Day"?
The Statista "Chart of the Day" currently focuses on two sectors: "Media and Technology", updated daily and featuring the latest statistics from the media, internet, telecommunications and consumer electronics industries; and "Economy and Society", which includes current data in the United States, as and when it becomes available, relating to economic and political issues.

Can Statista create customized charts?
Absolutely! For information on tailor-made and sector-specific Charts of the Day, please contact Felix Richter (felix.richter@statista.com).