
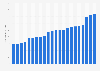


Average operating income of Major League Baseball teams 2005-2022
The average operating income per franchise in Major League Baseball stood at 17.32 million U.S. dollars in the 2022 season. This marked a slight decrease on the average operating income of 21.5 million U.S. dollars a season earlier.


