German  |  English
Features for this Basic Statistic
 

For download of graph → register for free


Do you have a question or a suggestion for this statistic? Please visit our contact page.
More statistics about...
 
You may also be interested in...
 
We are celebrating
 
International Year of Statistics 2013Statistics have powerful and far-reaching effects on everyone, yet most people are unaware of their connection and how statistics improve their lives. 2013 is the International Year of Statistics, a worldwide event supported by nearly 1,900 organizations - and we are part of it!learn more
Recommended Websites
 

Do you know of an interesting website related to this topic? Suggest here

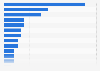
Operating income of National Hockey League franchises 2011/12


National Hockey League operating income by team 2011/12 season (in million U.S. dollars)

Register for free and benefit from the following extras:

  • Access to more than 10,000 statistics
  • Printing and download of PPT, XLS and JPEG files
  • Bookmark favorites in your profile

United States; Forbes; 2011/12 Source: Forbes


© Statista 2013

Reading support:
This graph depicts the operating income of all National Hockey League teams in the 2011/12 season. The operating income of the Nashville Predators franchise was at -3.4 million U.S. dollars in the 2011/12 season.

Statistic Information
 
Popular statistics
 
Viewed by other users
 
Latest statistics
 
Related reports
 
to: team, NHL, operating income, National Hockey League
How you can access Statista