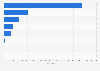
The total monthly payroll costs for local government employees who worked in higher education in the United States amounted to around 1.95 billion U.S. dollars in 2022. Local government payroll costs for police protection amounted to about 5.95 billion U.S. dollars in that same year.
Total monthly pay for local governmental employees in the United States in 2022, by job function (in million U.S. dollars)
Loading statistic...
Basic Account
Get to know the platform
You only have access to basic statistics.
Starter Account
The ideal entry-level account for individual users
- Instant access to 1m statistics
- Download in XLS, PDF & PNG format
- Detailed references
$199 USD / Month *
Professional Account
Full access
Business Solutions including all features.
* Prices do not include sales tax.
Other statistics that may interest you Statistics on
About the industry
10
- Basic Statistic U.S. number of government employees1982-2022
- Basic Statistic U.S. state government employee monthly payroll costs 2022, by job function
- Basic Statistic U.S. local government employees 2022, by job function
- Premium Statistic U.S. state government employees 2022, by job function
- Basic Statistic U.S. governmental payroll from 1982-2015
- Premium Statistic U.S. state and local government employees by full-/part-time status 1997-2022
- Premium Statistic Number of government office employees in Sweden 2022, by department
- Premium Statistic Full-time payroll of U.S. state and local governments, by employee function 2019
- Premium Statistic Average share of government employees in departments in Sweden 2017, by gender
- Premium Statistic Employees in the U.S. National Intelligence Program 2013, by agency
About the region
10
- Basic Statistic U.S. number of government employees 2022, by job function
- Basic Statistic U.S. gender pay gap by age group Q4 2023
- Basic Statistic Highest salaries in Major League Baseball 2023
- Basic Statistic Major League Baseball (MLB) rookie salary 2003-2023
- Basic Statistic Major League Baseball - payroll by team 2023
- Premium Statistic Highest paid musicians in the U.S. 2018
- Basic Statistic Annual salary of casino employees in Nevada 2000-2016
- Premium Statistic Work-life earnings of U.S. Bachelor's degree holders 2011, by occupation
- Basic Statistic U.S. university graduates median starting salaries 2012, various categories
- Basic Statistic Golf industry in the U.S. - total wage income by state 2009
Other regions
10
- Basic Statistic Full-time workers' income breakdown in Canada 2021
- Basic Statistic Annual salary for MPs UK 2010-2023
- Premium Statistic Cities with the highest average wage in China 2022
- Premium Statistic Number of people employed through agency work; selected countries worldwide 2021
- Basic Statistic Leading Seattle Sounders players 2023, by annual salary
- Basic Statistic Latin America: Congress members' monthly salary by country 2018
- Premium Statistic Gross annual earnings in the wholesale sector in Germany 1996-2022
- Premium Statistic Median wage per annum in retail trade industry in Hong Kong 2014-2021
- Basic Statistic Wages and salaries in the retail trade sector in Norway 2009-2021
- Premium Statistic Employee salary income per household in Taiwan 2012-2022
Related statistics
10
- Premium Statistic U.S. state and local tax collection Q1 2013- Q4 2023
- Basic Statistic U.S. government annual receipts Q1 2009- Q3 2023
- Basic Statistic U.S. government annual expenditure 2009-2023, by quarter
- Basic Statistic U.S. government budget surplus 2009-2023, by quarter
- Basic Statistic U.S. largest occupations: annual mean wages 2022
- Basic Statistic U.S. gender wage gap within the most common occupations for women 2021
- Basic Statistic U.S. gender wage gap, by industry 2021
- Basic Statistic U.S. contribution of wives' earnings to family income 1990-2020
- Basic Statistic U.S. government - total receipts 2000-2028
- Basic Statistic U.S. federal budget receipts and outlays 2000-2028
Further related statistics
10
- Median income of arts majors by study focus in the U.S. 2013
- Median income of communications and journalism majors by study focus in the U.S. 2013
- Median income of psychology and social work majors by study focus in the U.S. 2013
- Senior chief financial officer salary per annum in Switzerland 2023
- Number of employees at China Vanke 2010-2022
- Number of employees of Vinci worldwide 1991-2023
- Number of CBRE Group employees 2009-2022
- Financial controller salary per annum in banking in Belgium 2020, by experience
- Private equity specialist salary per annum in banking in Paris in 2020, by experience
- Annual income: change manager in finance projects London (UK) 2018
Further Content: You might find this interesting as well
Statistics
- Median income of arts majors by study focus in the U.S. 2013
- Median income of communications and journalism majors by study focus in the U.S. 2013
- Median income of psychology and social work majors by study focus in the U.S. 2013
- Senior chief financial officer salary per annum in Switzerland 2023
- Number of employees at China Vanke 2010-2022
- Number of employees of Vinci worldwide 1991-2023
- Number of CBRE Group employees 2009-2022
- Financial controller salary per annum in banking in Belgium 2020, by experience
- Private equity specialist salary per annum in banking in Paris in 2020, by experience
- Annual income: change manager in finance projects London (UK) 2018
US Census Bureau. (June 1, 2023). Total monthly pay for local governmental employees in the United States in 2022, by job function (in million U.S. dollars) [Graph]. In Statista. Retrieved April 23, 2024, from https://www.statista.com/statistics/204505/earnings-of-local-governmental-employees-in-the-us/
US Census Bureau. "Total monthly pay for local governmental employees in the United States in 2022, by job function (in million U.S. dollars)." Chart. June 1, 2023. Statista. Accessed April 23, 2024. https://www.statista.com/statistics/204505/earnings-of-local-governmental-employees-in-the-us/
US Census Bureau. (2023). Total monthly pay for local governmental employees in the United States in 2022, by job function (in million U.S. dollars). Statista. Statista Inc.. Accessed: April 23, 2024. https://www.statista.com/statistics/204505/earnings-of-local-governmental-employees-in-the-us/
US Census Bureau. "Total Monthly Pay for Local Governmental Employees in The United States in 2022, by Job Function (in Million U.S. Dollars)." Statista, Statista Inc., 1 Jun 2023, https://www.statista.com/statistics/204505/earnings-of-local-governmental-employees-in-the-us/
US Census Bureau, Total monthly pay for local governmental employees in the United States in 2022, by job function (in million U.S. dollars) Statista, https://www.statista.com/statistics/204505/earnings-of-local-governmental-employees-in-the-us/ (last visited April 23, 2024)
Total monthly pay for local governmental employees in the United States in 2022, by job function (in million U.S. dollars) [Graph], US Census Bureau, June 1, 2023. [Online]. Available: https://www.statista.com/statistics/204505/earnings-of-local-governmental-employees-in-the-us/