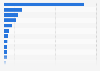
German  |  English
Features for this Premium Statistic
 

Do you have a question or a suggestion for this statistic? Please visit our contact page.
More statistics about...
 
You may also be interested in...
 
Recommended Websites
 

Do you know of an interesting website related to this topic? Suggest here

Monthly video use in the U.S. in Q3 2011, by activity (fee-based)


Monthly video users in the U.S. in the 3rd quarter 2011, by activity (in million)

Do you want to view this graph? Sign up for a Premium Account and benefit from the following extras:

  • Quick and convenient access to all statistics
  • More than 1.5 million statistics and facts
  • All data downloadable in PPT, XLS and JPG format

Get Account Source Get Account


© Statista 2013

Reading support:
The graph depicts the monthly number of video users in the U.S. in the third quarter of 2010 and 2011. On the average, almost 147 million people watched videos on the internet each month in the third quarter of 2011.

Statistic Information
 
Survey
Survey by  Get Account
Survey name  Get Account
Survey time period July 2011 to September 2011
Object of investigation Video users
Region United States
Macroregion North-America only
Type Ranking
Category resource/usage/use
Relevance 2
Age group 2 years and older
Release
Published by  Get Account
Source link  Get Account
Release date February 2012
Further information  Get Account
Popular statistics
 
Latest statistics
 
How you can access Statista