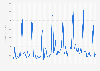
Monthly accessory revenue of the U.S. video game industry 2017-2023

Accessory revenue of the U.S. video game industry from January 2017 to March 2023

Download
Show detailed source information?
Register for free
Already a member?
Log in
Sources

Use Ask Statista Research Service

Release date

April 2023

Region

United States

Survey time period

January 2017 to March 2023

Supplementary notes

Up until June 2020, the Accessories segment included Video Game Accessories and Game Cards. This was changed in July 2020 and earlier values up until September 2019 were updated to reflect that change.
The NPD Group highlights that the data above represent retail revenue figures, and that there are separate estimates for video game content sold through other means. They are providing quarterly estimates of those extra-retail sales, including mobile games, downloadable content, and casual games, along with other segments.

Citation formats
Statista Accounts: Access All Statistics. Starting from $2,388 USD / Year
Basic Account
Get to know the platform

You only have access to basic statistics.
This statistic is not included in your account.

Starter Account
The ideal entry-level account for individual users
  • Instant access to 1m statistics
  • Download in XLS, PDF & PNG format
  • Detailed references
$199 USD / Month *
Professional Account
Full access

Business Solutions including all features.

* Prices do not include sales tax.

Statistics on " Video gaming market in the United States "

Other statistics that may interest you Video gaming market in the United States

Overview

5

Purchasing behavior

5

Consumer spending

8

Hardware sales

5

Software and content sales

7

Mobile gaming

7

Further related statistics

10
Statista Accounts: Access All Statistics. Starting from $2,388 USD / Year
Learn more about how Statista can support your business.