When Apple reported its third quarter results last night, most analysts were underwhelmed by the numbers: iPhone sales fell short of expectations and so did revenue. Investors shouldn’t get too nervous though, as the reasons for this (by Apple’s standards) disappointing quarter seem fairly obvious. Most importantly, the iPhone 5 is looming around the corner and many potential buyers are hesitant to buy a phone whose design has been unchanged for more than two years. Secondly, European markets aren’t doing too well at the moment which naturally affects a company selling high-end consumer electronics.
The results weren’t all bad though: Apple sold more than 17 million iPads from April through June, beating its own as well as many analysts’ expectations. Overall, the run the iPad has made since hitting the market in April 2010 is pretty remarkable. As of June 30, Apple had sold 84 million iPads. It took the iPhone 15 quarters to reach that number.
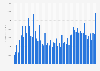
The Great Start of Apple's iPad


Description
This chart shows cumulative iPad and iPhone sales in the first nine quarters after their respective market debut.