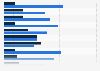
This statistic shows the very elderly population (ages 80 and over) as a percentage of the total population in the United Kingdom (UK) as forecasted from 2013 to 2060. The very elderly share of the population is projected to increase over the 47 year period by 4.8 percentage points.
Very elderly population (ages 80 and over) as a percentage of the total population in the United Kingdom (UK) from 2013 to 2060
Basic Account
Get to know the platform
You only have access to basic statistics.
This statistic is not included in your account.
Starter Account
The ideal entry-level account for individual users
- Instant access to 1m statistics
- Download in XLS, PDF & PNG format
- Detailed references
$199 USD / Month *
Professional Account
Full access
Business Solutions including all features.
* Prices do not include sales tax.
Other statistics that may interest you Aging population in China
Global overview
6
- Basic Statistic World population by age and region 2023
- Premium Statistic Projected share of aging population APAC 2023, by country
- Basic Statistic Life expectancy by continent and gender 2023
- Premium Statistic Projected life expectancy at birth East Asia 2023, by country
- Premium Statistic Projected median age East Asia 2023, by country
- Premium Statistic Breakdown of G20 countries with the highest age dependency ratio 2022
Population figures
7
- Basic Statistic Total population of China 1980-2029
- Basic Statistic Total fertility rate of China 1930-2020
- Premium Statistic Median age of the population in China 1950-2100
- Basic Statistic Share of population aged 60 and older in China 1950-2100
- Premium Statistic Share of population aged 80 and older in China 1950-2100
- Basic Statistic Male life expectancy in China 1960-2050
- Basic Statistic Female life expectancy in China 1960-2050
Healthcare burden
5
- Premium Statistic Health expenditure in China 2001-2022
- Premium Statistic Health expenditure in China as a proportion of GDP 2012-2022
- Premium Statistic Per capita spending of urban households in China on health care 1990-2023
- Premium Statistic Child, old-age, and total dependency ratio in China 1950-2100
- Premium Statistic Ratio of working-age adults to elderly in China 2000-2100
Elderly care
3
Financial situation
5
- Premium Statistic Number of people covered by public pension insurance in China 2012-2022
- Premium Statistic Number of retirees covered by public pension insurance in China 2012-2022
- Premium Statistic Public pension expenditure in China as a share of GDP 2012-2022
- Premium Statistic Expected sources for retirement income in China 2022
- Premium Statistic Barriers for those that have not started saving for retirement in China 2022
Further related statistics
10
- Location of death among hospice patients in the U.S. 2018
- Computer software: Online purchasing in Great Britain 2020, by age group
- Mobile internet use via laptops in Great Britain 2019, by demographic
- Reading frequency of book consumers in France 2017, by age
- Medicinal market growth worldwide including rebates 2009-2018
- Forecast in global carbon composite revenue for automotive market 2013-2022
- Current alcohol use in persons aged 12-20 in the U.S. by age 2002-2013
- Total population of Myanmar in 2014, by gender
- Percentage of U.S. adults with alcohol problems receiving treatment 2008-2011
- Sources of U.S. gasoline supply in 2000 and 2012
Further Content: You might find this interesting as well
Statistics
- Location of death among hospice patients in the U.S. 2018
- Computer software: Online purchasing in Great Britain 2020, by age group
- Mobile internet use via laptops in Great Britain 2019, by demographic
- Reading frequency of book consumers in France 2017, by age
- Medicinal market growth worldwide including rebates 2009-2018
- Forecast in global carbon composite revenue for automotive market 2013-2022
- Current alcohol use in persons aged 12-20 in the U.S. by age 2002-2013
- Total population of Myanmar in 2014, by gender
- Percentage of U.S. adults with alcohol problems receiving treatment 2008-2011
- Sources of U.S. gasoline supply in 2000 and 2012
European Commission. (May 3, 2015). Very elderly population (ages 80 and over) as a percentage of the total population in the United Kingdom (UK) from 2013 to 2060 [Graph]. In Statista. Retrieved June 17, 2024, from https://www.statista.com/statistics/478625/very-elderly-population-percentage-of-total-united-kingdom-uk/
European Commission. "Very elderly population (ages 80 and over) as a percentage of the total population in the United Kingdom (UK) from 2013 to 2060." Chart. May 3, 2015. Statista. Accessed June 17, 2024. https://www.statista.com/statistics/478625/very-elderly-population-percentage-of-total-united-kingdom-uk/
European Commission. (2015). Very elderly population (ages 80 and over) as a percentage of the total population in the United Kingdom (UK) from 2013 to 2060. Statista. Statista Inc.. Accessed: June 17, 2024. https://www.statista.com/statistics/478625/very-elderly-population-percentage-of-total-united-kingdom-uk/
European Commission. "Very Elderly Population (Ages 80 and Over) as a Percentage of The Total Population in The United Kingdom (Uk) from 2013 to 2060." Statista, Statista Inc., 3 May 2015, https://www.statista.com/statistics/478625/very-elderly-population-percentage-of-total-united-kingdom-uk/
European Commission, Very elderly population (ages 80 and over) as a percentage of the total population in the United Kingdom (UK) from 2013 to 2060 Statista, https://www.statista.com/statistics/478625/very-elderly-population-percentage-of-total-united-kingdom-uk/ (last visited June 17, 2024)
Very elderly population (ages 80 and over) as a percentage of the total population in the United Kingdom (UK) from 2013 to 2060 [Graph], European Commission, May 3, 2015. [Online]. Available: https://www.statista.com/statistics/478625/very-elderly-population-percentage-of-total-united-kingdom-uk/