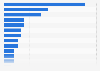
Distribution of TV VOD consumption in the UK 2015, by content provider

Distribution of TV video on-demand consumption in the United Kingdom (UK) in 2015, by content provider*

Download
Show detailed source information?
Register for free
Already a member?
Log in
Source

Use Ask Statista Research Service

Release date

December 2015

Region

United Kingdom

Survey time period

September 2-6, 2015

Number of respondents

2,651 respondents

Age group

16 years and older

Special properties

UK online population

Method of interview

Online survey

Supplementary notes

* Share of usage is taking both frequency and penetration into account and has been weighted to a value based on monthly frequency (e.g. a daily live TV viewing actually views c.30 'sessions' a month whereas a weekly viewer sees on average 4.3). Share of viewing is calculated by multiplying the total claimed session volume by the assumed duration of the average session (accounts for the fact that 1 daily live TV session is longer than the average catch-up TV session).

Citation formats
Use Statista now: Unlimited Access to All Statistics! $199 USD / Month
Basic Account
Get to know the platform

You only have access to basic statistics.
This statistic is not included in your account.

Starter Account
The ideal entry-level account for individual users
  • Instant access to 1m statistics
  • Download in XLS, PDF & PNG format
  • Detailed references
$199 USD / Month *
Professional Account
Full access

Business Solutions including all features.

* Prices do not include sales tax.

Statistics on " Sports on TV in the U.S. "

Other statistics that may interest you Sports on TV in the U.S.

Viewers

4

NFL

8

NFL - Super Bowl

8

NBA & WNBA

8

NHL

4

MLB

5

Soccer

6

Other sports

7

Further related statistics

8
All features, all contents, at all times: Learn more about our professional solutions.
Learn more about how Statista can support your business.