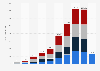
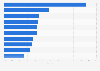
The statistic shows monthly BMW branded passenger vehicle sales in South Africa between June 2014 and June 2016. In June 2015, the German premium car manufacturer sold around 2,240 vehicles under its namesake brand.
Monthly sales of BMW branded vehicles in South Africa from 2014 to 2016 (in units)*
Basic Account
Get to know the platform
You only have access to basic statistics.
This statistic is not included in your account.
Starter Account
The ideal entry-level account for individual users
- Instant access to 1m statistics
- Download in XLS, PDF & PNG format
- Detailed references
$199 USD / Month *
Professional Account
Full access
Business Solutions including all features.
* Prices do not include sales tax.
Other statistics that may interest you Statistics on
About the industry
10
- Premium Statistic Vehicle sales of European car brands in the United States 2022
- Basic Statistic U.S. vehicle sales of North American car brands Q4 2022 & Q4 2023
- Premium Statistic South Africa - passenger vehicle sales by manufacturer 2019
- Premium Statistic Taiwan - passenger vehicle sales by manufacturer 2016
- Premium Statistic Vehicle sales of Asian car brands in the United States 2022
- Premium Statistic Mercedes-Benz Group: vehicle sales in the United States by segment Q4 2020-Q4 2022
- Premium Statistic BMW Group: U.S. vehicle sales by segment & quarter 2023
- Premium Statistic Ford Motor Company: vehicle sales in the United States by segment Q4 2020-Q4 2023
- Premium Statistic General Motors Company: vehicle sales in the United States by brand Q4 2020-Q4 2023
- Premium Statistic Toyota Motor Corporation's quarterly vehicle sales in the U.S. by brand 2020-2023
About the region
10
- Premium Statistic South Africa - VW passenger market share by brand 2018
- Premium Statistic Car ownership by make / brand in South Africa 2023
- Premium Statistic South African road fatalities - user category breakdown 2016
- Premium Statistic South Africa: VW light & medium commercial vehicle market share 2018
- Premium Statistic Alcohol market of South Africa: volumes 2014/2015, by category
- Premium Statistic Spirits market of South Africa: value 2006/2007-2014/2015, by category
- Premium Statistic Spirits market of South Africa: volumes 2006/2007-2014/2015, by category
- Premium Statistic Natural wine market of South Africa: volumes 2006/2007-2014/2015, by category
- Premium Statistic Alcohol in South Africa: volume market share 2006/2007-2014/2015, by category
- Premium Statistic Alcohol market of South Africa: value 2006/2007-2014/2015
Selected statistics
2
Other regions
10
- Premium Statistic U.S. vehicle sales - North American car brands December 2017-2018
- Basic Statistic North America: new passenger vehicle registrations by brand 2013-2016
- Premium Statistic Global Honda automobile sales by region 2023
- Premium Statistic Canadian Infiniti sales 2005-2015
- Premium Statistic Volkswagen car sales in Turkey 2012-2023
- Premium Statistic Monthly Stellantis vehicle sales in Mexico 2018-2022
- Premium Statistic China - passenger car sales by segment 2016
- Basic Statistic Most common car models on roads in the United Kingdom 2018
- Basic Statistic Suzuki car sales in Italy 2011-2020
- Premium Statistic Passenger cars and LCVs sales volume in Russia 2023, by brand
Related statistics
2
Further related statistics
10
- Mori Seiki's net sales FY 2006-FY2012
- Total sales of the Richemont Group worldwide 2008-2023
- Footwear retail sales volume trend in Great Britain (UK) 2008-2022
- Net sales of GameStop worldwide 2010-2022, by region
- Global net sales of Monster Beverage 2008-2022
- Global Lindt & Sprüngli sales 2010-2022
- Sales of International House of Pancakes (IHOP) restaurants in the U.S. 2009-2023
- Distribution of Electrolux's sales from 2014 to 2023, by business area
- Flowers Foods: sales share in the U.S. 2021 & 2022, by segment
- Flowers Foods: sales in the U.S. 2010-2023
Further Content: You might find this interesting as well
Statistics
- Mori Seiki's net sales FY 2006-FY2012
- Total sales of the Richemont Group worldwide 2008-2023
- Footwear retail sales volume trend in Great Britain (UK) 2008-2022
- Net sales of GameStop worldwide 2010-2022, by region
- Global net sales of Monster Beverage 2008-2022
- Global Lindt & Sprüngli sales 2010-2022
- Sales of International House of Pancakes (IHOP) restaurants in the U.S. 2009-2023
- Distribution of Electrolux's sales from 2014 to 2023, by business area
- Flowers Foods: sales share in the U.S. 2021 & 2022, by segment
- Flowers Foods: sales in the U.S. 2010-2023
Focus2move. (July 8, 2016). Monthly sales of BMW branded vehicles in South Africa from 2014 to 2016 (in units)* [Graph]. In Statista. Retrieved May 13, 2024, from https://www.statista.com/statistics/632112/monthly-sales-of-bmw-branded-vehicles-in-south-africa/
Focus2move. "Monthly sales of BMW branded vehicles in South Africa from 2014 to 2016 (in units)*." Chart. July 8, 2016. Statista. Accessed May 13, 2024. https://www.statista.com/statistics/632112/monthly-sales-of-bmw-branded-vehicles-in-south-africa/
Focus2move. (2016). Monthly sales of BMW branded vehicles in South Africa from 2014 to 2016 (in units)*. Statista. Statista Inc.. Accessed: May 13, 2024. https://www.statista.com/statistics/632112/monthly-sales-of-bmw-branded-vehicles-in-south-africa/
Focus2move. "Monthly Sales of Bmw Branded Vehicles in South Africa from 2014 to 2016 (in Units)*." Statista, Statista Inc., 8 Jul 2016, https://www.statista.com/statistics/632112/monthly-sales-of-bmw-branded-vehicles-in-south-africa/
Focus2move, Monthly sales of BMW branded vehicles in South Africa from 2014 to 2016 (in units)* Statista, https://www.statista.com/statistics/632112/monthly-sales-of-bmw-branded-vehicles-in-south-africa/ (last visited May 13, 2024)
Monthly sales of BMW branded vehicles in South Africa from 2014 to 2016 (in units)* [Graph], Focus2move, July 8, 2016. [Online]. Available: https://www.statista.com/statistics/632112/monthly-sales-of-bmw-branded-vehicles-in-south-africa/