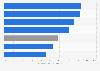
Share of consumers who use meal delivery services in Australia 2018 by urbanization
This statistic depicts the results of a survey conducted between April 2017 and March 2018 about the share of consumers who used meal delivery services in Australia in the last 12 months, by urbanization. During the survey period, around 12.6 percent of respondents residing in urban areas in Australia used a meal delivery service in the last year.