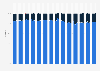
During the third quarter of 2020, around 0.75 billion mobile apps have been downloaded from Google Play in the Philippines. In comparison, an average of 0.08 billion mobile apps were downloaded from the Apple App Store during this period.
Average number of mobile apps downloaded in the Philippines as of 3rd quarter 2020, by app store (in billions)
Basic Account
Get to know the platform
You only have access to basic statistics.
This statistic is not included in your account.
Starter Account
The ideal entry-level account for individual users
- Instant access to 1m statistics
- Download in XLS, PDF & PNG format
- Detailed references
$199 USD / Month *
Professional Account
Full access
Business Solutions including all features.
* Prices do not include sales tax.
Other statistics that may interest you Smartphones in Brazil
Overview
5
- Premium Statistic Gross revenue from mobile telephony services in Brazil 2000-2022
- Premium Statistic Revenue of the smartphones industry in Brazil 2018-2028
- Premium Statistic Mobile phone production in Brazil 2000-2022
- Premium Statistic Mobile phone unit sales in Brazil 2000-2022
- Premium Statistic Average smartphones price in Brazil 2018-2028
Companies
6
- Premium Statistic Market share of mobile device vendors in Brazil 2010-2023
- Premium Statistic Apple mobile device market share in Brazil 2010-2023
- Premium Statistic Samsung mobile device market share in Brazil 2010-2023
- Premium Statistic Motorola mobile device market share in Brazil 2010-2023
- Premium Statistic Most popular smartphone brands in Brazil 2024
- Premium Statistic Willingness to change smartphone brand in Brazil 2024
Operating systems
3
Lines and subscriptions
8
- Premium Statistic Number of cell sites in Brazil 2002-2022
- Premium Statistic Number of mobile phone lines in Brazil 1996-2023
- Premium Statistic Brazil: mobile phone connections per 100 inhabitants 1996-2023
- Premium Statistic Brazil: number of mobile cellular subscriptions 2000-2022
- Premium Statistic Mobile-cellular subscriptions per 100 inhabitants in Brazil 2000-2022
- Premium Statistic Mobile phone subscriptions in Brazil 1998-2023, by technology
- Premium Statistic Mobile broadband subscriptions in Brazil 2016-2022, by technology
- Premium Statistic Number of smartphone users in Brazil 2029-2029
Consumption
5
- Premium Statistic Consumer electronics ownership in Brazil 2024
- Premium Statistic Digital device ownership in Brazil 2024
- Premium Statistic Digital device used to access the iinternet in Brazil 2023
- Premium Statistic Digital device used to play video games in Brazil 2023
- Premium Statistic Brazil: usage of functions in selected mobile messaging apps 2023
Further related statistics
10
- Use of mobile devices to make restaurant reservations in the U.S. 2014, by age group
- LG Electronics revenue by segment 2016-2023, by quarter
- Number of AT&T of connected device subscribers 2009-2023
- Device usage among children to consume media in the United Kingdom (UK) 2013-2019
- Internet usage on a mobile phone in Great Britain 2010-2019, by age
- Device preference for internet browsing in the United Kingdom (UK) 2015, by age
- Use of smartphones by shoppers in retail stores in Italy in 2015
- Leading trends in technology in restaurants in the U.S. 2015*
- Daily time children spent with media in the U.S. in 2011 and 2013
- U.S. cell phone owners who use mobile banking 2013, by ethnicity
Further Content: You might find this interesting as well
Statistics
- Use of mobile devices to make restaurant reservations in the U.S. 2014, by age group
- LG Electronics revenue by segment 2016-2023, by quarter
- Number of AT&T of connected device subscribers 2009-2023
- Device usage among children to consume media in the United Kingdom (UK) 2013-2019
- Internet usage on a mobile phone in Great Britain 2010-2019, by age
- Device preference for internet browsing in the United Kingdom (UK) 2015, by age
- Use of smartphones by shoppers in retail stores in Italy in 2015
- Leading trends in technology in restaurants in the U.S. 2015*
- Daily time children spent with media in the U.S. in 2011 and 2013
- U.S. cell phone owners who use mobile banking 2013, by ethnicity
FinancesOnline. (July 29, 2021). Average number of mobile apps downloaded in the Philippines as of 3rd quarter 2020, by app store (in billions) [Graph]. In Statista. Retrieved June 15, 2024, from https://www.statista.com/statistics/1254078/philippines-mobile-apps-downloaded-by-app-store/
FinancesOnline. "Average number of mobile apps downloaded in the Philippines as of 3rd quarter 2020, by app store (in billions)." Chart. July 29, 2021. Statista. Accessed June 15, 2024. https://www.statista.com/statistics/1254078/philippines-mobile-apps-downloaded-by-app-store/
FinancesOnline. (2021). Average number of mobile apps downloaded in the Philippines as of 3rd quarter 2020, by app store (in billions). Statista. Statista Inc.. Accessed: June 15, 2024. https://www.statista.com/statistics/1254078/philippines-mobile-apps-downloaded-by-app-store/
FinancesOnline. "Average Number of Mobile Apps Downloaded in The Philippines as of 3rd Quarter 2020, by App Store (in Billions)." Statista, Statista Inc., 29 Jul 2021, https://www.statista.com/statistics/1254078/philippines-mobile-apps-downloaded-by-app-store/
FinancesOnline, Average number of mobile apps downloaded in the Philippines as of 3rd quarter 2020, by app store (in billions) Statista, https://www.statista.com/statistics/1254078/philippines-mobile-apps-downloaded-by-app-store/ (last visited June 15, 2024)
Average number of mobile apps downloaded in the Philippines as of 3rd quarter 2020, by app store (in billions) [Graph], FinancesOnline, July 29, 2021. [Online]. Available: https://www.statista.com/statistics/1254078/philippines-mobile-apps-downloaded-by-app-store/