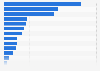
This statistic represents the foreign tourist arrivals from eastern Europe into India in 2017, by average duration of stay. Tourists from Ukraine stayed the longest, accounting for an average of 25.6 days during the measured time period.
Foreign tourist arrivals from eastern Europe to India in 2017, by average duration of stay
Basic Account
Get to know the platform
You only have access to basic statistics.
This statistic is not included in your account.
Starter Account
The ideal entry-level account for individual users
- Instant access to 1m statistics
- Download in XLS, PDF & PNG format
- Detailed references
$199 USD / Month *
Professional Account
Full access
Business Solutions including all features.
* Prices do not include sales tax.
Other statistics that may interest you Inbound tourism in Spain
Key figures
7
- Premium Statistic Countries with the highest number of inbound tourist arrivals worldwide 2019-2023
- Premium Statistic Destinations with the highest inbound tourism receipts worldwide 2019-2023
- Premium Statistic Contribution of inbound tourism spending to Spanish GDP 2010-2021
- Premium Statistic Contribution of inbound tourism spending to Spanish exports of services 2010-2021
- Premium Statistic International tourism spending in Spain 2012-2022
- Premium Statistic Quarterly online revenue of travel agencies from inbound spending in Spain 2017-2022
- Basic Statistic Share of travel and tourism spending in Spain 2022, by traveler origin
Tourism volume
5
- Premium Statistic Inbound same-day and overnight visitors in Spain 2010-2022
- Premium Statistic Inbound tourism volume in Spain 2023, by transport mode
- Premium Statistic Inbound tourism volume in Spain 2023, by travel reason
- Premium Statistic Inbound tourism volume in Spain 2023, by lodging type
- Premium Statistic Inbound tourism volume in Spain 2023, by origin
Main source markets
6
- Premium Statistic British tourists in Spain 2010-2022
- Premium Statistic Per capita spend by British tourists in Spain 2010-2022
- Premium Statistic French tourists in Spain 2010-2022
- Premium Statistic Per capita spend by French tourists in Spain 2010-2022
- Premium Statistic German tourists in Spain 2010-2022
- Premium Statistic Per capita spend by German tourists in Spain 2010-2022
Main destinations
6
- Premium Statistic European travelers' favorite destinations for their next European trip 2024
- Premium Statistic Inbound tourism volume in Spain 2023, by region of destination
- Premium Statistic Inbound tourism volume in Catalonia 2023, by travel reason
- Premium Statistic Inbound tourism volume in the Balearic Islands 2022, by island
- Premium Statistic Inbound tourism volume in the Canary Islands 2022, by main island
- Premium Statistic Spanish cities with the largest number of international hotel guests 2023
Further related statistics
9
- Number of international tourist arrivals APAC 2019, by country or region
- Passenger traffic at Dubai Airports from 2010 to 2020*
- Busch Gardens Tampa Bay theme park attendance 2009-2022
- Walt Disney World Magic Kingdom theme park attendance 2009-2022
- Disneyland theme park (California) attendance 2009-2022
- Walt Disney World Animal Kingdom theme park attendance 2009-2022
- Universal Orlando Islands of Adventure theme park attendance 2009-2022
- Most visited amusement and theme parks in North America 2022
- Change in attendance at amusement and theme parks in Europe 2019-2022
Further Content: You might find this interesting as well
Statistics
- Number of international tourist arrivals APAC 2019, by country or region
- Passenger traffic at Dubai Airports from 2010 to 2020*
- Busch Gardens Tampa Bay theme park attendance 2009-2022
- Walt Disney World Magic Kingdom theme park attendance 2009-2022
- Disneyland theme park (California) attendance 2009-2022
- Walt Disney World Animal Kingdom theme park attendance 2009-2022
- Universal Orlando Islands of Adventure theme park attendance 2009-2022
- Most visited amusement and theme parks in North America 2022
- Change in attendance at amusement and theme parks in Europe 2019-2022
Ministry of Tourism (India). (April 4, 2019). Foreign tourist arrivals from eastern Europe to India in 2017, by average duration of stay [Graph]. In Statista. Retrieved June 11, 2024, from https://www.statista.com/statistics/1018385/india-fta-from-eastern-europe-by-the-average-duration-of-stay/
Ministry of Tourism (India). "Foreign tourist arrivals from eastern Europe to India in 2017, by average duration of stay ." Chart. April 4, 2019. Statista. Accessed June 11, 2024. https://www.statista.com/statistics/1018385/india-fta-from-eastern-europe-by-the-average-duration-of-stay/
Ministry of Tourism (India). (2019). Foreign tourist arrivals from eastern Europe to India in 2017, by average duration of stay . Statista. Statista Inc.. Accessed: June 11, 2024. https://www.statista.com/statistics/1018385/india-fta-from-eastern-europe-by-the-average-duration-of-stay/
Ministry of Tourism (India). "Foreign Tourist Arrivals from Eastern Europe to India in 2017, by Average Duration of Stay ." Statista, Statista Inc., 4 Apr 2019, https://www.statista.com/statistics/1018385/india-fta-from-eastern-europe-by-the-average-duration-of-stay/
Ministry of Tourism (India), Foreign tourist arrivals from eastern Europe to India in 2017, by average duration of stay Statista, https://www.statista.com/statistics/1018385/india-fta-from-eastern-europe-by-the-average-duration-of-stay/ (last visited June 11, 2024)
Foreign tourist arrivals from eastern Europe to India in 2017, by average duration of stay [Graph], Ministry of Tourism (India), April 4, 2019. [Online]. Available: https://www.statista.com/statistics/1018385/india-fta-from-eastern-europe-by-the-average-duration-of-stay/