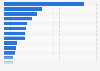
TikTok is a video-sharing social media app owned by Beijing-based tech company ByteDance.
According to a study conducted between 2022 and 2023, #PerfumeTok saw a 453 percent change year over year. Additionally, usage of #PerfumeTikTok increased by almost 280 percent, year over year. Year-on-year change in perfume related hashtags on TikTok from 2022 to 2023
Basic Account
Get to know the platform
You only have access to basic statistics.
Starter Account
The ideal entry-level account for individual users
- Instant access to 1m statistics
- Download in XLS, PDF & PNG format
- Detailed references
$199 USD / Month *
Professional Account
Full access
Business Solutions including all features.
* Prices do not include sales tax.
Other statistics that may interest you Statistics on
About the industry
10
- Premium Statistic Top ten entertainment YouTube channels in India 2023, by number of views
- Premium Statistic Top ten entertainment YouTube channels in India 2023, by subscribers
- Premium Statistic X user share in Russia 2024, by gender
- Basic Statistic Meta annual ad spend 2014-2023
- Premium Statistic Social commerce usage in the U.S. & UK 2022, by gender and activity
- Premium Statistic Social media use frequency among teens South Korea 2020
- Premium Statistic Top ten coffee and tea brands on YouTube Malaysia 2020, by total uploaded video views
- Premium Statistic Leading airlines on Facebook Malaysia 2020, by number of fans
- Premium Statistic Leading car brands on Facebook Indonesia 2020, by number of fans
- Premium Statistic Leading car brands on Facebook Singapore 2020, by number of fans
About the region
10
- Premium Statistic Global brand following and brand post sharing via social 2017, by region
- Basic Statistic Meta: daily active people (DAP) 2018-2024
- Basic Statistic Meta: quarterly net income 2010-2024
- Basic Statistic Meta: monthly active product family users 2023
- Basic Statistic Meta: annual marketing expenditure worldwide 2010-2023
- Premium Statistic Social media ad spend growth worldwide 2021-2022
- Premium Statistic Global Instagram follower engagement rate 2024, by type of post
- Premium Statistic Social media platforms used in influencer campaigns worldwide 2021
- Premium Statistic Popular Instagram influencer topics worldwide 2020, by annual follower growth
- Premium Statistic Share of art buyers using Instagram to discover artists worldwide 2016-2020
Selected statistics
3
Other regions
10
- Premium Statistic Leading industries on Facebook in Malaysia 2020, by number of local fans
- Premium Statistic Leading Facebook pages of clothing brands Egypt 2019, by number of local fans
- Premium Statistic Colombia: main brands based on Instagram presence 2018
- Premium Statistic Factors influencing belief in news India 2018
- Premium Statistic Entertainment Instagram accounts with the most followers in the world 2019
- Premium Statistic Leading celebrities YouTube Lebanon 2019, by views
- Premium Statistic Leading industries on Facebook in Singapore 2020, by number of local fans
- Premium Statistic Leading industries on Facebook in the UAE 2019, by number of local fans
- Premium Statistic Leading industries on Facebook in Saudi Arabia 2019, by number of fans
- Premium Statistic Effects of Instagram removing likes in Italy 2019, by sector
Related statistics
10
- Basic Statistic U.S. social media user satisfaction of platform privacy & amount of ads 2018
- Basic Statistic Leading online activities ever carried out in the United Kingdom (UK) 2023
- Premium Statistic French children awareness about the privacy of their social media account(s) 2020
- Basic Statistic Online activities carried out in the prior week in the United Kingdom (UK) 2020
- Premium Statistic Technology U.S. teens use to stay connected during coronavirus pandemic 2020
- Basic Statistic Facebook: trust with personal information among U.S. users 2019, by age
- Basic Statistic Adjusting privacy settings on social media sites in Denmark 2015-2019
- Basic Statistic Adjusting privacy settings on social media sites in Sweden 2015-2019
- Basic Statistic Adjusting privacy settings on social media sites in Finland 2019
- Basic Statistic Perceived difficulty of changing privacy settings on social media in Finland 2019
Further related statistics
9
- Leading trends in technology in restaurants in the U.S. 2015*
- Social network usage for news access worldwide 2019-2023
- Paid ad methods used for B2C content marketing North America 2022
- Consumer electronics: Online purchasing in Great Britain 2020, by demographic
- Travel arrangements: Online purchasing in Great Britain 2019, by demographic
- India: leading e-commerce categories 2013, by sales
- Where consumers shop for clothing and footwear in the United Kingdom (UK) 2013
- Channels consumers use for their main grocery shop in the United Kingdom (UK) 2013
- Furniture shopping: Consumers' delivery preferences in the United Kingdom (UK) 2013
Further Content: You might find this interesting as well
Statistics
- Leading trends in technology in restaurants in the U.S. 2015*
- Social network usage for news access worldwide 2019-2023
- Paid ad methods used for B2C content marketing North America 2022
- Consumer electronics: Online purchasing in Great Britain 2020, by demographic
- Travel arrangements: Online purchasing in Great Britain 2019, by demographic
- India: leading e-commerce categories 2013, by sales
- Where consumers shop for clothing and footwear in the United Kingdom (UK) 2013
- Channels consumers use for their main grocery shop in the United Kingdom (UK) 2013
- Furniture shopping: Consumers' delivery preferences in the United Kingdom (UK) 2013
Luxurynsight. (May 1, 2023). Year-on-year change in perfume related hashtags on TikTok from 2022 to 2023 [Graph]. In Statista. Retrieved June 01, 2024, from https://www.statista.com/statistics/1386541/tiktok-yoy-perfume-related-hashtags/
Luxurynsight. "Year-on-year change in perfume related hashtags on TikTok from 2022 to 2023." Chart. May 1, 2023. Statista. Accessed June 01, 2024. https://www.statista.com/statistics/1386541/tiktok-yoy-perfume-related-hashtags/
Luxurynsight. (2023). Year-on-year change in perfume related hashtags on TikTok from 2022 to 2023. Statista. Statista Inc.. Accessed: June 01, 2024. https://www.statista.com/statistics/1386541/tiktok-yoy-perfume-related-hashtags/
Luxurynsight. "Year-on-year Change in Perfume Related Hashtags on Tiktok from 2022 to 2023." Statista, Statista Inc., 1 May 2023, https://www.statista.com/statistics/1386541/tiktok-yoy-perfume-related-hashtags/
Luxurynsight, Year-on-year change in perfume related hashtags on TikTok from 2022 to 2023 Statista, https://www.statista.com/statistics/1386541/tiktok-yoy-perfume-related-hashtags/ (last visited June 01, 2024)
Year-on-year change in perfume related hashtags on TikTok from 2022 to 2023 [Graph], Luxurynsight, May 1, 2023. [Online]. Available: https://www.statista.com/statistics/1386541/tiktok-yoy-perfume-related-hashtags/