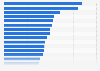
It was predicted that the mean estimated quarterly earnings per share (EPS) of Berkshire Hathaway would amount to 13.97 U.S. dollars in 2023. This is a slight increase from the predicted EPS of 11.79 for the 2021.
Mean estimated earnings per share of Berkshire Hathaway Inc from 2021 to 2023 (in U.S. dollars)
Basic Account
Get to know the platform
You only have access to basic statistics.
This statistic is not included in your account.
Starter Account
The ideal entry-level account for individual users
- Instant access to 1m statistics
- Download in XLS, PDF & PNG format
- Detailed references
$199 USD / Month *
Professional Account
Full access
Business Solutions including all features.
* Prices do not include sales tax.
Other statistics that may interest you Berkshire Hathaway
Overview
5
- Basic Statistic Biggest companies in the world by market value 2023
- Premium Statistic Top companies in the world by revenue 2023
- Premium Statistic Biggest 50 insurance companies worldwide May 2023, by market cap
- Premium Statistic Leading insurance companies globally 2022, by revenue
- Premium Statistic Gross premiums of the insurance industry worldwide 2000-2022
Financial data
6
- Premium Statistic Total revenue of Berkshire Hathaway 2009-2023
- Premium Statistic Revenue of Berkshire Hathaway by source 2016-2023
- Premium Statistic Net earnings of Berkshire Hathaway 2009-2023
- Premium Statistic Berkshire Hathaway number of employees 2010-2023
- Premium Statistic Total assets of Berkshire Hathaway 2009-2023
- Premium Statistic Berkshire Hathaway's investments by asset type 2016-2023
Segmentation
7
- Premium Statistic Revenues of Berkshire Hathaway 2023, by operating business
- Premium Statistic Berkshire Hathaway total assets 2016-2023, by business segment
- Premium Statistic Life and health insurance premiums written by Berkshire Hathaway 2011-2023
- Premium Statistic Life and health premiums written by Berkshire Hathaway 2014-2023, by region
- Premium Statistic Property and casualty premiums written by Berkshire Hathaway 2011-2023
- Premium Statistic Property and casualty premiums written by Berkshire Hathaway 2014-2023, by region
- Premium Statistic Earned premiums of GEICO 2008-2023
Competitors
5
- Premium Statistic Largest reinsurers worldwide 2020-2022, by net premiums written
- Premium Statistic Leading insurance companies in the U.S. 2022, by total assets
- Premium Statistic Leading U.S. writers of property and casualty insurance 2020-2022, by premiums
- Premium Statistic Leading writers of commercial lines insurance in the U.S. 2021-2022, by premiums
- Premium Statistic Leading private passenger auto insurers in the U.S. 2021-2022, by premiums
Environmental, social and governance
3
Further related statistics
10
- Return on average common shareholder equity at Goldman Sachs 2009-2023
- Net interest income of Deutsche Bank 2006-2023
- Net revenue from investment banking at Goldman Sachs 2009-2023
- Shareholders equity at Allianz Group 2008-2023
- Total number of shares issued by Allianz Group 2009-2023
- Structure of investment portfolio of Allianz Group 2014-2023
- Walgreens operating income in the U.S. 2005-2023
- Value of assets managed by global ETFs 2010-2017, by region
- Number of mutual funds worldwide 2011-2014, by country
- Value of global financial assets 1990-2013
Further Content: You might find this interesting as well
Statistics
- Return on average common shareholder equity at Goldman Sachs 2009-2023
- Net interest income of Deutsche Bank 2006-2023
- Net revenue from investment banking at Goldman Sachs 2009-2023
- Shareholders equity at Allianz Group 2008-2023
- Total number of shares issued by Allianz Group 2009-2023
- Structure of investment portfolio of Allianz Group 2014-2023
- Walgreens operating income in the U.S. 2005-2023
- Value of assets managed by global ETFs 2010-2017, by region
- Number of mutual funds worldwide 2011-2014, by country
- Value of global financial assets 1990-2013
Quandl. (October 25, 2021). Mean estimated earnings per share of Berkshire Hathaway Inc from 2021 to 2023 (in U.S. dollars) [Graph]. In Statista. Retrieved June 15, 2024, from https://www.statista.com/statistics/630489/forecast-of-mean-eps-of-berkshire-hathaway/
Quandl. "Mean estimated earnings per share of Berkshire Hathaway Inc from 2021 to 2023 (in U.S. dollars)." Chart. October 25, 2021. Statista. Accessed June 15, 2024. https://www.statista.com/statistics/630489/forecast-of-mean-eps-of-berkshire-hathaway/
Quandl. (2021). Mean estimated earnings per share of Berkshire Hathaway Inc from 2021 to 2023 (in U.S. dollars). Statista. Statista Inc.. Accessed: June 15, 2024. https://www.statista.com/statistics/630489/forecast-of-mean-eps-of-berkshire-hathaway/
Quandl. "Mean Estimated Earnings per Share of Berkshire Hathaway Inc from 2021 to 2023 (in U.S. Dollars)." Statista, Statista Inc., 25 Oct 2021, https://www.statista.com/statistics/630489/forecast-of-mean-eps-of-berkshire-hathaway/
Quandl, Mean estimated earnings per share of Berkshire Hathaway Inc from 2021 to 2023 (in U.S. dollars) Statista, https://www.statista.com/statistics/630489/forecast-of-mean-eps-of-berkshire-hathaway/ (last visited June 15, 2024)
Mean estimated earnings per share of Berkshire Hathaway Inc from 2021 to 2023 (in U.S. dollars) [Graph], Quandl, October 25, 2021. [Online]. Available: https://www.statista.com/statistics/630489/forecast-of-mean-eps-of-berkshire-hathaway/