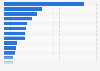
The earnings before interest tax, depreciation and amortization (EBITDA) of The Walt Disney Company was expected to amount to approximately 3.3 billion U.S. dollars in the second quarter of 2022.
Forecast of EBITDA of The Walt Disney Co from 1st quarter 2021 to 2nd quarter 2022 (in million U.S. dollars)
Basic Account
Get to know the platform
You only have access to basic statistics.
This statistic is not included in your account.
Starter Account
The ideal entry-level account for individual users
- Instant access to 1m statistics
- Download in XLS, PDF & PNG format
- Detailed references
$199 USD / Month *
Professional Account
Full access
Business Solutions including all features.
* Prices do not include sales tax.
Other statistics that may interest you Disney Advertising
Overview
6
- Premium Statistic Largest media companies worldwide 2022
- Premium Statistic Global revenue of the Walt Disney Company 2006-2023
- Premium Statistic Revenue of Walt Disney's entertainment business 2008-2022
- Premium Statistic Walt Disney Company ad revenue 2022-2023
- Premium Statistic Walt Disney Company ad revenue share 2022-2023
- Premium Statistic Walt Disney Company ad revenue 2022-2023, by segment
Segments
6
- Premium Statistic AVOD and TV advertising revenue in the U.S. 2017-2027
- Premium Statistic TV advertising spending in the U.S. 2023-2027, by type
- Premium Statistic Walt Disney Company linear networks ad revenue 2022-2023
- Premium Statistic CTV ad spend in the U.S. 2019-2027
- Premium Statistic Walt Disney Company DTC ad revenue 2022-2023
- Premium Statistic Number of brands using Disney Advertising clean room 2023
Competitors
6
- Premium Statistic Top streaming platforms to which ad professionals allocated upfront spend U.S. 2023
- Premium Statistic Ad revenues of top ad-supported video streaming services in the U.S. 2022
- Premium Statistic Ad revenues of top ad-supported video streaming services in the U.S. 2026
- Premium Statistic Estimated ad revenue of Netflix and Disney+ in the U.S. 2023-2025
- Premium Statistic CTV ad spend share in the U.S. 2020-2024, by company
- Premium Statistic Ranking of video streaming service in the U.S. 2022-2023, by CTV time share
Audience & consumption
8
- Premium Statistic Expected change in media usage among U.S. consumers 2023
- Premium Statistic Number of subscribers to Disney-owned TV channels 2023
- Premium Statistic Share of subscribers of video streaming services in the U.S. 2023, by plan type
- Premium Statistic Viewers who would rather watch ads than pay more for ad-free services U.S. 2021-2023
- Premium Statistic Preference of ad-supported vs. ad-free video streaming in the U.S. 2023, by age group
- Premium Statistic Share of video streaming users monthly in the U.S. 2022, by platform
- Basic Statistic ESPN+ subscriber numbers in the U.S. 2019-2024
- Premium Statistic Digital video ad views in the U.S. 2023, by platform
Further related statistics
10
- Value of global financial assets 1990-2013
- Structure of investment portfolio of Allianz Group 2014-2023
- Rio Tinto's net income 2005-2023
- Walgreens operating income in the U.S. 2005-2023
- Value of assets managed by global ETFs 2010-2017, by region
- Number of mutual funds worldwide 2011-2014, by country
- Senior chief financial officer salary per annum in Switzerland 2023
- BayWa's revenue by segment 2010-2022
- Return on average common shareholder equity at Goldman Sachs 2009-2023
- Syngenta's sales in the crop protection segment worldwide 2013-2022
Further Content: You might find this interesting as well
Statistics
- Value of global financial assets 1990-2013
- Structure of investment portfolio of Allianz Group 2014-2023
- Rio Tinto's net income 2005-2023
- Walgreens operating income in the U.S. 2005-2023
- Value of assets managed by global ETFs 2010-2017, by region
- Number of mutual funds worldwide 2011-2014, by country
- Senior chief financial officer salary per annum in Switzerland 2023
- BayWa's revenue by segment 2010-2022
- Return on average common shareholder equity at Goldman Sachs 2009-2023
- Syngenta's sales in the crop protection segment worldwide 2013-2022
Quandl. (July 12, 2022). Forecast of EBITDA of The Walt Disney Co from 1st quarter 2021 to 2nd quarter 2022 (in million U.S. dollars) [Graph]. In Statista. Retrieved June 15, 2024, from https://www.statista.com/statistics/633573/forecast-of-ebitda-of-the-walt-disney-quarterly/
Quandl. "Forecast of EBITDA of The Walt Disney Co from 1st quarter 2021 to 2nd quarter 2022 (in million U.S. dollars)." Chart. July 12, 2022. Statista. Accessed June 15, 2024. https://www.statista.com/statistics/633573/forecast-of-ebitda-of-the-walt-disney-quarterly/
Quandl. (2022). Forecast of EBITDA of The Walt Disney Co from 1st quarter 2021 to 2nd quarter 2022 (in million U.S. dollars). Statista. Statista Inc.. Accessed: June 15, 2024. https://www.statista.com/statistics/633573/forecast-of-ebitda-of-the-walt-disney-quarterly/
Quandl. "Forecast of Ebitda of The Walt Disney Co from 1st Quarter 2021 to 2nd Quarter 2022 (in Million U.S. Dollars)." Statista, Statista Inc., 12 Jul 2022, https://www.statista.com/statistics/633573/forecast-of-ebitda-of-the-walt-disney-quarterly/
Quandl, Forecast of EBITDA of The Walt Disney Co from 1st quarter 2021 to 2nd quarter 2022 (in million U.S. dollars) Statista, https://www.statista.com/statistics/633573/forecast-of-ebitda-of-the-walt-disney-quarterly/ (last visited June 15, 2024)
Forecast of EBITDA of The Walt Disney Co from 1st quarter 2021 to 2nd quarter 2022 (in million U.S. dollars) [Graph], Quandl, July 12, 2022. [Online]. Available: https://www.statista.com/statistics/633573/forecast-of-ebitda-of-the-walt-disney-quarterly/