In China, about 11.5 percent of sales in the non-alcoholic drinks market occurred online in 2023. By 2027, the share of online sales in this market is set to increase to an estimated 13.1 percent.
Distribution of non-alcoholic drink sales in China from 2017 to 2027, by channel
Other statistics that may interest you Non-alcoholic beverages in China
Market overview
5
- Premium Statistic Revenue of the non-alcoholic drinks market worldwide by country 2022
- Premium Statistic China: revenue of non-alcoholic drinks 2014-2027, by type
- Premium Statistic Non-alcoholic drink monthly production in China 2022-2023
- Premium Statistic Import value of non-alcoholic beverages APAC 2021, by country
- Premium Statistic Export value of non-alcoholic beverages APAC 2021, by country
Retail
5
- Premium Statistic Non-alcoholic beverage retail sales breakdown in China 2020, by type
- Premium Statistic Retail sales value of soft beverages in China 2020-2025, by type
- Premium Statistic 
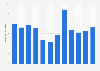
Sales value of non-alcoholic drinks in China 2017-2027, by sales channel
- Premium Statistic Retail sales value of non-alcoholic beverages in China 2019-2024, by sales channel
- Premium Statistic Online sales value of major beverage brands on Alibaba platforms in China 2020
Major product types
5
- Premium Statistic Retail sales value of bottled water in China 2013-2020
- Premium Statistic Retail sales value of tea beverages in China 2019-2024, by type
- Premium Statistic Retail sales value of juice beverages in China 2019-2024, by type
- Premium Statistic China: revenue of the soft drink market 2014-2027, by type
- Premium Statistic Market size of energy drinks in China 2011-2020
Leading brands
5
- Premium Statistic Brand value of the most valuable soft drink brands worldwide 2023
- Premium Statistic Market share of non-alcoholic drinks in China 2019, by enterprise
- Premium Statistic Fastest-growing beverage brands in China 2022
- Premium Statistic Share of carbonated beverage market in China 2019, by company
- Premium Statistic Leading energy drinks brands in China 2020, based on offline sales share
Consumption
5
- Premium Statistic Leading type of drinks purchased by consumers in China in 2020
- Premium Statistic Major factors when choosing non-alcoholic beverages in China 2019, by gender
- Premium Statistic Leading channels to get information on beverages in China 2020
- Premium Statistic Most preferred locations to buy beverages in China 2020
- Premium Statistic Share of consumers who prefer sugar-free drinks in China 2020
Further related statistics
14
- Sales channels of non-alcoholic drinks Philippines 2017-2025
- China: average price per unit of non-alcoholic drinks 2014-2027
- Indonesia: sales volume per capita of non-alcoholic drinks market 2019-2027, by type
- Producer revenue of bottled water in the U.S. 2014-2018
- Indonesia: sales channels of non-alcoholic drinks 2017-2023
- Philippines: revenue growth of non-alcoholic drinks market 2023-2027, by type
- Consumption volume of non-alcoholic beverages in Sweden 2011-2017, by type
- Leading soft drink brands in the United Kingdom 2014, by grocery market share
- Soft drinks value share of sales in grocery multiples in the United Kingdom 2014
- Grocery multiples: Soft drinks sales volume share in the United Kingdom 2014
- Soft drinks: Grocery and convenience sales volume change in the United Kingdom 2013
- Soft drinks impulse sales volume share in the United Kingdom 2014, by category
- Soft drinks impulse sales value share in the United Kingdom 2014, by category
- Diet soft drinks sales value in pubs and clubs in the United Kingdom 2014, by type
Further Content: You might find this interesting as well
Statistics
- Sales channels of non-alcoholic drinks Philippines 2017-2025
- China: average price per unit of non-alcoholic drinks 2014-2027
- Indonesia: sales volume per capita of non-alcoholic drinks market 2019-2027, by type
- Producer revenue of bottled water in the U.S. 2014-2018
- Indonesia: sales channels of non-alcoholic drinks 2017-2023
- Philippines: revenue growth of non-alcoholic drinks market 2023-2027, by type
- Consumption volume of non-alcoholic beverages in Sweden 2011-2017, by type
- Leading soft drink brands in the United Kingdom 2014, by grocery market share
- Soft drinks value share of sales in grocery multiples in the United Kingdom 2014
- Grocery multiples: Soft drinks sales volume share in the United Kingdom 2014
- Soft drinks: Grocery and convenience sales volume change in the United Kingdom 2013
- Soft drinks impulse sales volume share in the United Kingdom 2014, by category
- Soft drinks impulse sales value share in the United Kingdom 2014, by category
- Diet soft drinks sales value in pubs and clubs in the United Kingdom 2014, by type
Statista Consumer Market Insights. (October 10, 2023). Distribution of non-alcoholic drink sales in China from 2017 to 2027, by channel [Graph]. In Statista. Retrieved December 03, 2023, from https://www.statista.com/forecasts/1202530/sales-channels-non-alcoholic-drinks-chile
Statista Consumer Market Insights. "Distribution of non-alcoholic drink sales in China from 2017 to 2027, by channel." Chart. October 10, 2023. Statista. Accessed December 03, 2023. https://www.statista.com/forecasts/1202530/sales-channels-non-alcoholic-drinks-chile
Statista Consumer Market Insights. (2023). Distribution of non-alcoholic drink sales in China from 2017 to 2027, by channel. Statista. Statista Inc.. Accessed: December 03, 2023. https://www.statista.com/forecasts/1202530/sales-channels-non-alcoholic-drinks-chile
Statista Consumer Market Insights. "Distribution of Non-alcoholic Drink Sales in China from 2017 to 2027, by Channel." Statista, Statista Inc., 10 Oct 2023, https://www.statista.com/forecasts/1202530/sales-channels-non-alcoholic-drinks-chile
Statista Consumer Market Insights, Distribution of non-alcoholic drink sales in China from 2017 to 2027, by channel Statista, https://www.statista.com/forecasts/1202530/sales-channels-non-alcoholic-drinks-chile (last visited December 03, 2023)
Distribution of non-alcoholic drink sales in China from 2017 to 2027, by channel [Graph], Statista Consumer Market Insights, October 10, 2023. [Online]. Available: https://www.statista.com/forecasts/1202530/sales-channels-non-alcoholic-drinks-chile