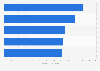
This description shows the results of a customer satisfaction survey about auto stores in Australia as of March 2019. During the period examined, 89 percent of respondents said they were happy with Autobarn.
Share of customer satisfaction among auto stores in Australia as of March 2019
Basic Account
Get to know the platform
You only have access to basic statistics.
This statistic is not included in your account.
Starter Account
The ideal entry-level account for individual users
- Instant access to 1m statistics
- Download in XLS, PDF & PNG format
- Detailed references
$229 USD $199 USD / Month *
in the first 12 months
Professional Account
Full access
Business Solutions including all features.
* Prices do not include sales tax.
Other statistics that may interest you Statistics on
About the industry
10
- Premium Statistic Furniture and electrical retailer customer satisfaction in Australia 2019
- Premium Statistic AutoZone - number of employees 2010-2022
- Basic Statistic Mobile World Investment's net revenue 2014-2021
- Premium Statistic Mobile World Investment's profit after tax 2014-2021
- Premium Statistic Mobile World Investment's number of stores 2015-2021
- Premium Statistic O’Reilly Automotive - total assets 2004-2021
- Premium Statistic Mobile World Investment's online revenue 2014-2018
- Premium Statistic Mobile World Investment's number of stores 2017-2018, by product category
- Premium Statistic O’Reilly Automotive - net income 2004-2018
- Premium Statistic Advance Auto Parts - total assets 2018
About the region
10
- Premium Statistic Clothing retailer customer satisfaction in Australia 2018
- Premium Statistic Customer satisfaction in Australia June 2020 by industry
- Premium Statistic Drivers of supermarket customer satisfaction Australia 2019
- Premium Statistic Overall supermarket customer satisfaction in Australia 2019
- Premium Statistic Supermarket customer satisfaction with product range in Australia 2019 by chain
- Premium Statistic Supermarket customer satisfaction with own brand products in Australia 2019
- Premium Statistic Supermarket customer satisfaction with quality of fresh products in Australia 2019
- Premium Statistic Supermarket customer satisfaction with product availability in Australia 2019
- Premium Statistic Supermarket customer satisfaction with store appearance and layout in Australia 2019
- Premium Statistic Supermarkets customers would recommend in Australia 2019
Other regions
10
- Premium Statistic Brazil: automotive imports from the European Union 2010-2022
- Premium Statistic Leading toy properties ranked by sales in the EU-5 2017
- Premium Statistic U.S. department and discount store consumer satisfaction: Walmart 2008-2023
- Premium Statistic Distribution of vehicle after-sales market in China by channel 2015-2020
- Premium Statistic Leading retail and consumer goods companies in Europe by market cap 2015
- Premium Statistic Leading 10 most popular licensed toys among children in the UK Q1 2019
- Premium Statistic Reasons to visit a physical store in the Netherlands 2020
- Premium Statistic Denso - expenses for research and development 2008-2022
- Premium Statistic O'Reilly Auto Parts- revenue 2004-2022
- Premium Statistic Share of crops exports from Ghana 2018, by importing country
Related statistics
10
- Premium Statistic Value for money score of selected beers in Australia 2019
- Premium Statistic Quality score of selected beers in Australia 2019
- Premium Statistic Overall retail sector customer satisfaction in New Zealand 2018
- Premium Statistic Retail sector customer satisfaction in New Zealand 2018
- Premium Statistic Retail sector customer service satisfaction in New Zealand 2018
- Premium Statistic Retail sector value for money satisfaction in New Zealand 2018
- Premium Statistic Yearly retail spending per person in New Zealand 2018, by type
- Premium Statistic Warehouse group net profit in New Zealand 2017-2018
- Premium Statistic Warehouse group revenue New Zealand 2018 by segment
- Premium Statistic Warehouse Group employee wages and salaries New Zealand 2017-2018
Further related statistics
10
- U.S. value of automotive parts sourced from U.S. located suppliers 2000-2010
- Under Armour's operating income worldwide 2008-2023
- John Lewis Partnership: number of employees in the United Kingdom (UK) 2009-2023
- John Lewis sales revenue in the United Kingdom (UK) 2009-2023
- Waitrose sales revenue in the United Kingdom (UK) 2009-2023
- Mondelez International's operating income worldwide 2011-2022
- Mondelez International's global workforce by region 2012-2022
- Mondelez International's net revenue distribution worldwide by sector 2022
- Victoria's Secret's net sales worldwide from 2010 to 2022
- Net income of Church & Dwight worldwide 2009-2022
Further Content: You might find this interesting as well
Statistics
- U.S. value of automotive parts sourced from U.S. located suppliers 2000-2010
- Under Armour's operating income worldwide 2008-2023
- John Lewis Partnership: number of employees in the United Kingdom (UK) 2009-2023
- John Lewis sales revenue in the United Kingdom (UK) 2009-2023
- Waitrose sales revenue in the United Kingdom (UK) 2009-2023
- Mondelez International's operating income worldwide 2011-2022
- Mondelez International's global workforce by region 2012-2022
- Mondelez International's net revenue distribution worldwide by sector 2022
- Victoria's Secret's net sales worldwide from 2010 to 2022
- Net income of Church & Dwight worldwide 2009-2022
Roy Morgan. (May 3, 2019). Share of customer satisfaction among auto stores in Australia as of March 2019 [Graph]. In Statista. Retrieved October 02, 2023, from https://www.statista.com/statistics/1003583/customer-satisfaction-auto-stores-australia/
Roy Morgan. "Share of customer satisfaction among auto stores in Australia as of March 2019." Chart. May 3, 2019. Statista. Accessed October 02, 2023. https://www.statista.com/statistics/1003583/customer-satisfaction-auto-stores-australia/
Roy Morgan. (2019). Share of customer satisfaction among auto stores in Australia as of March 2019. Statista. Statista Inc.. Accessed: October 02, 2023. https://www.statista.com/statistics/1003583/customer-satisfaction-auto-stores-australia/
Roy Morgan. "Share of Customer Satisfaction among Auto Stores in Australia as of March 2019." Statista, Statista Inc., 3 May 2019, https://www.statista.com/statistics/1003583/customer-satisfaction-auto-stores-australia/
Roy Morgan, Share of customer satisfaction among auto stores in Australia as of March 2019 Statista, https://www.statista.com/statistics/1003583/customer-satisfaction-auto-stores-australia/ (last visited October 02, 2023)
Share of customer satisfaction among auto stores in Australia as of March 2019 [Graph], Roy Morgan, May 3, 2019. [Online]. Available: https://www.statista.com/statistics/1003583/customer-satisfaction-auto-stores-australia/