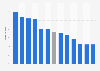
This statistic shows the year-on-year change in existing homes sold in British Columbia from 2018 to 2020. Sales of existing homes in British Columbia were expected to increase by 23.9 percent between 2019 and 2020.
Year-on-year change in existing homes sold in British Columbia from 2018 to 2020
Basic Account
Get to know the platform
You only have access to basic statistics.
This statistic is not included in your account.
Single Account
The ideal entry-level account for individual users
- Instant access to 1m statistics
- Download in XLS, PDF & PNG format
- Detailed references
$59 $39 / Month *
in the first 12 months
Corporate Account
Full access
Corporate solution including all features.
* Prices do not include sales tax.
Further Content: You might find this interesting as well
Statistics
- House sales in Prince Edward Island 2020-2022
- Yoy change in existing home prices Saskatchewan 2018-2020
- House sales Saskatchewan, Canada 2019-2021
- Yoy change in existing home prices British Columbia 2018-2020
- Yoy change in existing home prices Prince Edward Island 2018-2020
- Yoy change in existing home sales New Brunswick 2018-2020
- House sales Alberta, Canada 2020-2022
- Yoy change in existing home prices Alberta 2018-2020
- Yoy change in existing home prices Newfound and Labrador 2018-2020
- Yoy change in existing home prices Canada 2018-2020
- Housing sales in France 2007-2020, by category
- House sales in Quebec 2020-2022
- Yoy change in existing home prices New Brunswick 2018-2020
- Yoy change in existing home sales Ontario 2018-2020
- House sales in Ontario 2015-2020
- Yoy change in existing home prices Nova Scotia 2018-2020
- Yoy change in existing home sales Nova Scotia 2018-2020
- House sales British Columbia 2020-2022
- Yoy change in existing home sales Prince Edward Island 2018-2020
- Yoy change in existing home sales Quebec 2018-2020
TD Bank. (February 11, 2020). Year-on-year change in existing homes sold in British Columbia from 2018 to 2020 [Graph]. In Statista. Retrieved May 24, 2022, from https://www.statista.com/statistics/1006616/yoy-change-in-existing-home-sales-british-columbia/
TD Bank. "Year-on-year change in existing homes sold in British Columbia from 2018 to 2020." Chart. February 11, 2020. Statista. Accessed May 24, 2022. https://www.statista.com/statistics/1006616/yoy-change-in-existing-home-sales-british-columbia/
TD Bank. (2020). Year-on-year change in existing homes sold in British Columbia from 2018 to 2020. Statista. Statista Inc.. Accessed: May 24, 2022. https://www.statista.com/statistics/1006616/yoy-change-in-existing-home-sales-british-columbia/
TD Bank. "Year-on-year Change in Existing Homes Sold in British Columbia from 2018 to 2020." Statista, Statista Inc., 11 Feb 2020, https://www.statista.com/statistics/1006616/yoy-change-in-existing-home-sales-british-columbia/
TD Bank, Year-on-year change in existing homes sold in British Columbia from 2018 to 2020 Statista, https://www.statista.com/statistics/1006616/yoy-change-in-existing-home-sales-british-columbia/ (last visited May 24, 2022)