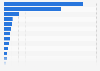
This statistic displays the share of the mobile revenue market in Singapore as of 2019. As of this date, Singtel accounted for 50 percent of the mobile revenue market in Singapore, whereas StarHub accounted for around 26 percent.
Share of the mobile revenue market in Singapore as of 2019, by operator
Basic Account
Get to know the platform
You only have access to basic statistics.
This statistic is not included in your account.
Starter Account
The ideal entry-level account for individual users
- Instant access to 1m statistics
- Download in XLS, PDF & PNG format
- Detailed references
$149 USD / Month *
Professional Account
Full access
Business Solutions including all features.
* Prices do not include sales tax.
Other statistics that may interest you Statistics on
About the industry
10
- Premium Statistic StarHub's mobile revenue 2018-2022
- Premium Statistic StarHub's cable TV and broadband revenue Singapore 2018-2022
- Premium Statistic StarHub's equipment sale revenue 2018-2022
- Premium Statistic StarHub Limited's total revenue FY 2016-2022
- Basic Statistic M1's operating revenue in Singapore 2017-2022
- Basic Statistic Revenue of BT Group FY 2013-2023, by business segment and quarter
- Premium Statistic StarHub's fixed network revenue 2018-2019
- Premium Statistic Market share of broadband subscribers in Singapore 2016
- Basic Statistic Maxis Bhd's total revenue in Malaysia 2015-2022
- Premium Statistic Fixed broadband ARPU of TrueOnline Thailand 2017-2022
About the region
10
- Premium Statistic Mobile service revenue growth in Singapore 2016-2019
- Premium Statistic Local revenue breakdown in the publishing industry Singapore 2018, by services
- Premium Statistic Local revenue breakdown in the film and video industry Singapore 2018, by services
- Premium Statistic Overseas revenue breakdown in the film and video industry Singapore 2018, by services
- Premium Statistic Revenue breakdown in the games industry Singapore 2018, by products or services
- Premium Statistic Total revenue breakdown in the film and video industry Singapore 2018, by services
- Premium Statistic Overseas revenue breakdown in the games industry Singapore 2018, by services
- Premium Statistic Local revenue breakdown in the games industry Singapore 2018, by services
- Premium Statistic Local revenue breakdown in the broadcasting industry Singapore 2018, by services
- Premium Statistic Revenue breakdown in the broadcasting industry Singapore 2018, by services
Other regions
10
- Premium Statistic Revenue of film and video industry in Finland 2016-2021, by sector
- Premium Statistic Market share of the main food retailers in France 2017, by brand
- Premium Statistic Digital music - share of overall music sales in Germany 2004-2022
- Basic Statistic Italy: share of SME revenue from in international trade 2016-2018, by band
- Premium Statistic Market share of mobile subscribers in Singapore 2016
- Basic Statistic Sweden: share of SME revenue from in international trade 2018, by band
- Basic Statistic Greece: share of SME revenue from in international trade 2018, by band
- Premium Statistic Revenue from retail sales in cosmetic & toilet articles stores in Czechia 2010-2017
- Basic Statistic Revenues of telecommunications services per capita in the Nordics 2018-2019
- Basic Statistic Actions that would drive revenue growth in Romanian companies 2021
Related statistics
10
- Premium Statistic Overseas revenue breakdown in the broadcasting industry Singapore 2018, by services
- Premium Statistic Overseas revenue breakdown in the publishing industry Singapore 2018, by services
- Premium Statistic Total revenue breakdown in the publishing industry Singapore 2018, by services
- Premium Statistic Singapore market share printer consumables 2013-2015, by origin
- Premium Statistic Number of tablet users in Singapore 2017-2028
- Premium Statistic Tablet penetration rate in Singapore 2017-2028
- Basic Statistic Mobile internet penetration rate in Singapore 2012-2028
- Premium Statistic Import value of oral and dental hygiene products to Singapore 2013-2022
- Premium Statistic Import value of soap and other skin washes to Singapore 2013-2022
- Premium Statistic Import value of cosmetics from China to Singapore 2013-2022
Further related statistics
10
- Total sales of the Richemont Group worldwide 2008-2023
- Revenue of Sinopharm 2011-2022, by category
- FIFA World Cup marketing revenue by segment 2013-2015
- Revenue forecast of the global spirits industry 2009-2015
- Operating income of the Industrial and Commercial Bank of China 2012-2022
- Revenue of the Bank of Communications 2022
- Ping An Insurance's annual revenue 2012-2022
- Annual revenue of China Tourism Group Duty Free 2012-2022
- BayWa's revenue by segment 2010-2022
- Danone: recurring operating margin by geographical region, 2016-2022
Further Content: You might find this interesting as well
Statistics
- Total sales of the Richemont Group worldwide 2008-2023
- Revenue of Sinopharm 2011-2022, by category
- FIFA World Cup marketing revenue by segment 2013-2015
- Revenue forecast of the global spirits industry 2009-2015
- Operating income of the Industrial and Commercial Bank of China 2012-2022
- Revenue of the Bank of Communications 2022
- Ping An Insurance's annual revenue 2012-2022
- Annual revenue of China Tourism Group Duty Free 2012-2022
- BayWa's revenue by segment 2010-2022
- Danone: recurring operating margin by geographical region, 2016-2022
DBS Group Research. (December 11, 2020). Share of the mobile revenue market in Singapore as of 2019, by operator [Graph]. In Statista. Retrieved December 10, 2023, from https://www.statista.com/statistics/1007915/singapore-mobile-revenue-market-share/
DBS Group Research. "Share of the mobile revenue market in Singapore as of 2019, by operator." Chart. December 11, 2020. Statista. Accessed December 10, 2023. https://www.statista.com/statistics/1007915/singapore-mobile-revenue-market-share/
DBS Group Research. (2020). Share of the mobile revenue market in Singapore as of 2019, by operator. Statista. Statista Inc.. Accessed: December 10, 2023. https://www.statista.com/statistics/1007915/singapore-mobile-revenue-market-share/
DBS Group Research. "Share of The Mobile Revenue Market in Singapore as of 2019, by Operator." Statista, Statista Inc., 11 Dec 2020, https://www.statista.com/statistics/1007915/singapore-mobile-revenue-market-share/
DBS Group Research, Share of the mobile revenue market in Singapore as of 2019, by operator Statista, https://www.statista.com/statistics/1007915/singapore-mobile-revenue-market-share/ (last visited December 10, 2023)
Share of the mobile revenue market in Singapore as of 2019, by operator [Graph], DBS Group Research, December 11, 2020. [Online]. Available: https://www.statista.com/statistics/1007915/singapore-mobile-revenue-market-share/