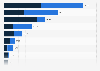
The number of bed-places available in hotels and similar accommodation in Belarus has increased over the period from 2010 to 2021. In the latest year under consideration, there were 4.03 bed-places per thousand inhabitants available in hotels nationwide.
Available capacity of hotels and similar accommodation in Belarus from 2010 to 2021 (in bed-places per 1,000 inhabitants)
Basic Account
Get to know the platform
You only have access to basic statistics.
This statistic is not included in your account.
Starter Account
The ideal entry-level account for individual users
- Instant access to 1m statistics
- Download in XLS, PDF & PNG format
- Detailed references
$199 USD / Month *
Professional Account
Full access
Business Solutions including all features.
* Prices do not include sales tax.
Other statistics that may interest you Statistics on
About the industry
10
- Premium Statistic Available capacity of hotels in Croatia 2010-2021
- Premium Statistic Available capacity of hotels in Latvia 2010-2021
- Premium Statistic Available capacity of hotels in Czechia 2010-2021
- Premium Statistic Number of hotel bed-places in Ukraine 2010-2020
- Premium Statistic Available capacity of hotels in Estonia 2010-2021
- Premium Statistic Available capacity of hotels in Romania 2010-2021
- Premium Statistic Available capacity of hotels in Ukraine 2010-2020
- Premium Statistic Available capacity of hotels in Moldova 2010-2021
- Premium Statistic Available capacity of hotels in Slovenia 2010-2021
- Premium Statistic Number of hotel bed-places in Romania 2010-2021
About the region
6
- Premium Statistic Average length of stay in hotels in Belarus 2010-2021
- Premium Statistic Number of hotel bed-places in Belarus 2010-2021
- Premium Statistic Outbound tourism departures from Belarus 2010-2021
- Premium Statistic Tourism intensity in Belarus 2010-2021
- Premium Statistic Inbound tourist arrivals for personal purposes in Belarus 2010-2021
- Premium Statistic Inbound tourist arrivals by road transport in Belarus 2010-2021
Other regions
10
- Premium Statistic Occupancy rate of hotel bed-places in Ukraine 2012-2020
- Premium Statistic Capacity of hotels in Belgium 2011-2020
- Premium Statistic Number of domestic and international overnight stays in hotels in Sweden 2018
- Premium Statistic Average length of stay in hotels in Hungary 2010-2021
- Premium Statistic Number of sold hotel and holiday resort rooms in Denmark 2019-2020, by region
- Premium Statistic Airbnb rentals in Utrecht in the Netherlands 2011-2017
- Premium Statistic Airbnb rentals in Adelaide in Australia 2010-2018
- Premium Statistic Room occupancy in New Zealand 2019
- Premium Statistic Quarterly Airbnb rental figures in LA 2016-2019
- Basic Statistic Canary Islands: number of tourist bed places in 2019, by island
Related statistics
10
- Premium Statistic Number of hotel rooms in Ukraine 2010-2020
- Premium Statistic Number of hotels and similar accommodation in Ukraine 2010-2020
- Premium Statistic Average number of nights spent in hotels in Estonia 2010-2021
- Premium Statistic Available capacity of hotels in Serbia 2010-2020
- Premium Statistic Average length of stay in travel accommodation in Latvia 2017-2022, by type
- Premium Statistic Average length of stay in hotels in Croatia 2010-2021
- Premium Statistic Available capacity of hotels in Bosnia and Herzegovina 2010-2021
- Premium Statistic Number of hotel bed-places in Lithuania 2010-2020
- Premium Statistic Available capacity of hotels in Georgia 2010-2021
- Premium Statistic Available capacity of hotels in Lithuania 2010-2020
Further related statistics
10
- Foreign exchange earnings from tourism in India 2000-2022
- Quarterly average daily rate of hotels in Indianapolis 2016-2017
- Quarterly average daily rate of hotels in New York 2016-2017
- Quarterly average daily rate of hotels in Philadelphia 2016-2017
- Quarterly average daily rate of hotels in Portland 2016-2017
- Quarterly average daily rate of hotels in Seattle 2016-2017
- Quarterly average daily rate of hotels in San Diego 2016-2017
- Quarterly average daily rate in hotels in Washington D.C. 2016-2017
- Quarterly average daily rate of hotels in Brussels 2010-2017
- Quarterly average daily rate of hotels in Atlanta 2016-2017
Further Content: You might find this interesting as well
Statistics
- Foreign exchange earnings from tourism in India 2000-2022
- Quarterly average daily rate of hotels in Indianapolis 2016-2017
- Quarterly average daily rate of hotels in New York 2016-2017
- Quarterly average daily rate of hotels in Philadelphia 2016-2017
- Quarterly average daily rate of hotels in Portland 2016-2017
- Quarterly average daily rate of hotels in Seattle 2016-2017
- Quarterly average daily rate of hotels in San Diego 2016-2017
- Quarterly average daily rate in hotels in Washington D.C. 2016-2017
- Quarterly average daily rate of hotels in Brussels 2010-2017
- Quarterly average daily rate of hotels in Atlanta 2016-2017
World Tourism Organization (UN Tourism). (October 14, 2022). Available capacity of hotels and similar accommodation in Belarus from 2010 to 2021 (in bed-places per 1,000 inhabitants) [Graph]. In Statista. Retrieved April 20, 2024, from https://www.statista.com/statistics/1016012/capacity-of-hotel-bad-places-in-belarus/
World Tourism Organization (UN Tourism). "Available capacity of hotels and similar accommodation in Belarus from 2010 to 2021 (in bed-places per 1,000 inhabitants)." Chart. October 14, 2022. Statista. Accessed April 20, 2024. https://www.statista.com/statistics/1016012/capacity-of-hotel-bad-places-in-belarus/
World Tourism Organization (UN Tourism). (2022). Available capacity of hotels and similar accommodation in Belarus from 2010 to 2021 (in bed-places per 1,000 inhabitants). Statista. Statista Inc.. Accessed: April 20, 2024. https://www.statista.com/statistics/1016012/capacity-of-hotel-bad-places-in-belarus/
World Tourism Organization (UN Tourism). "Available Capacity of Hotels and Similar Accommodation in Belarus from 2010 to 2021 (in Bed-places per 1,000 Inhabitants)." Statista, Statista Inc., 14 Oct 2022, https://www.statista.com/statistics/1016012/capacity-of-hotel-bad-places-in-belarus/
World Tourism Organization (UN Tourism), Available capacity of hotels and similar accommodation in Belarus from 2010 to 2021 (in bed-places per 1,000 inhabitants) Statista, https://www.statista.com/statistics/1016012/capacity-of-hotel-bad-places-in-belarus/ (last visited April 20, 2024)
Available capacity of hotels and similar accommodation in Belarus from 2010 to 2021 (in bed-places per 1,000 inhabitants) [Graph], World Tourism Organization (UN Tourism), October 14, 2022. [Online]. Available: https://www.statista.com/statistics/1016012/capacity-of-hotel-bad-places-in-belarus/