
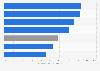


Most congested city centers in the world 2023
Real travel times in Dublin are 66 percent longer than travel under free-flow conditions, making it the most congested urban sprawl in the world as of 2023. This figure refers to additional average travel time throughout the week.
Tackling trust in transport
With trust in public transport globally taking a knock following the outbreak of Covid-19, switching to public transport modes for commuting trips to save time, emissions, and traffic may prove difficult. Activities at transit stations declined in many cities around the world as a result of ebbing demand amid the coronavirus pandemic. Consequently, transport services in highly populated cities have suffered devastating financial losses. While public transport transit had started to pick up in the beginning of 2021, it could not offset the drop recorded as a result of the pandemic.
India: a climate for new policies?
Among the twelve cities displayed, India is represented by three. To tackle high levels of congestion, a congestion pricing policy was recently proposed in India, which would serve to introduce parking fees and thus push commuters to take public transport rather than drive their cars to work. Surveys collecting public opinion on this proposal have indicated that this would be a popular policy, should it be implemented. The motive behind curbing congestion in the nation’s largest cities is more than just to reduce pollution levels and time spent in traffic; India has some of the highest levels of traffic-related fatalities globally: some 151,100 people died in traffic accidents in 2019 – this is the highest number on record since 2005.


