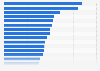
In 2021, there were around 66,300 industrial enterprises above designated size in Guangdong province, which leads the manufacturing industry in China. Besides having numerous factories producing products for foreign brands, the province is also the manufacturing hub to some leading Chinese brands.
Number of industrial enterprises above designated size in Guangdong from 2011 to 2021
Basic Account
Get to know the platform
You only have access to basic statistics.
This statistic is not included in your account.
Starter Account
The ideal entry-level account for individual users
- Instant access to 1m statistics
- Download in XLS, PDF & PNG format
- Detailed references
$229 USD $199 USD / Month *
in the first 12 months
Professional Account
Full access
Business Solutions including all features.
* Prices do not include sales tax.
Other statistics that may interest you Statistics on
About the industry
10
- Premium Statistic Profits of industrial enterprises in Guangdong 2011-2021
- Premium Statistic Number of private industrial enterprises in Guangdong 2011-2021
- Premium Statistic Number of industrial enterprises in China 2011-2021, by size
- Premium Statistic Number of small and medium-sized industrial companies in China by region 2017
- Premium Statistic Companies manufacturing beverages in Italy 2019, by legal form
- Premium Statistic Manufacturers of carpets and rugs in Italy 2014-2018
- Premium Statistic Leather clothes manufacturers in Italy 2018, by legal form
- Premium Statistic Companies manufacturing prepared animal feeds in Italy 2018, by legal form
- Premium Statistic Firms preparing and spinning textile fibers in Italy 2018, by legal form
- Premium Statistic Firms packaging linens and furnishings in Italy 2018, by legal form
About the region
10
- Premium Statistic Share of marketing and promotion methods used by enterprises China 2016
- Premium Statistic Online advertising of companies in China 2016
- Premium Statistic Computer usage of companies in China as of December 2014 by company size
- Premium Statistic Total assets of enterprises in China's Pearl River Delta 2021, by sector
- Premium Statistic Total assets of enterprises in China's Pearl River Delta 2021, by size
- Premium Statistic Total revenue of enterprises in China's Pearl River Delta 2021, by industry type
- Premium Statistic Revenue of enterprises in China's Pearl River Delta 2021, by size
- Premium Statistic Revenue of enterprises in China's Pearl River Delta 2021, by sector
- Premium Statistic Pre-tax profits of enterprises in China's Pearl River Delta 2021, by ownership
- Premium Statistic Number of enterprises in China's Pearl River Delta 2021, by ownership
Other regions
10
- Premium Statistic Firms distilling, rectifying and blending spirits in Italy 2014-2020, by legal form
- Basic Statistic Switzerland: enterprises in the non-financial business economy 2015, by employment
- Premium Statistic Number of small medium-enterprises (SMEs) in Poland 2018-2022, by size
- Premium Statistic Number of enterprises in Bahrain by size 2018
- Premium Statistic Ecuador: distribution of businesses by size 2018
- Basic Statistic Portugal: enterprises in the non-financial business economy 2016, by employment size
- Basic Statistic Denmark: enterprises in the non-financial business economy 2016, by employment size
- Basic Statistic Bulgaria: enterprises in the non-financial business economy 2016, by employment size
- Basic Statistic Âustria: enterprises in the non-financial business economy 2016, by employment size
- Basic Statistic Belgium: enterprises in the non-financial business economy 2016, by employment size
Related statistics
10
- Premium Statistic Number of enterprises in Taiwan 2011-2021
- Premium Statistic Sales revenue of commercial enterprises in Taiwan 2011-2021
- Premium Statistic Pre-tax profits of enterprises in China's Pearl River Delta 2021, by sector
- Premium Statistic Number of enterprises in China's Pearl River Delta 2021
- Premium Statistic Number of enterprises in China's Pearl River Delta 2021, by industry type
- Premium Statistic Profit of industrial enterprises in China 2021, by size
- Premium Statistic Core business revenue of industrial enterprises in China 2021, by size
- Premium Statistic Pre-tax profits of enterprises in China's Pearl River Delta 2021, by size
- Premium Statistic Number of enterprises in China's Pearl River Delta 2021, by size of the enterprise
- Premium Statistic Lifelong education market size in China 2016-2024
Further related statistics
10
- Revenue of Sohu in China 2022, by segment
- Baidu's total revenue 2012-2022
- UK console gaming reach 2015-2022, by gender
- Daily internet use penetration in Great Britain 2006-2020
- Number of internet users in Great Britain 2006-2020, by frequency
- Households with internet access in GB from 2014 to 2020, by household composition
- Hours of internet use per week in the United Kingdom (UK) 2005-2019, by location
- Mobile internet use via laptops in Great Britain 2019, by demographic
- Internet usage on a mobile phone in Great Britain 2010-2019, by age
- Forecast: global data center IP traffic 2013-2021, by segment
Further Content: You might find this interesting as well
Statistics
- Revenue of Sohu in China 2022, by segment
- Baidu's total revenue 2012-2022
- UK console gaming reach 2015-2022, by gender
- Daily internet use penetration in Great Britain 2006-2020
- Number of internet users in Great Britain 2006-2020, by frequency
- Households with internet access in GB from 2014 to 2020, by household composition
- Hours of internet use per week in the United Kingdom (UK) 2005-2019, by location
- Mobile internet use via laptops in Great Britain 2019, by demographic
- Internet usage on a mobile phone in Great Britain 2010-2019, by age
- Forecast: global data center IP traffic 2013-2021, by segment
National Bureau of Statistics of China. (February 13, 2023). Number of industrial enterprises above designated size in Guangdong from 2011 to 2021 [Graph]. In Statista. Retrieved October 01, 2023, from https://www.statista.com/statistics/1033758/industrial-enterprises-number-in-guangdong/
National Bureau of Statistics of China. "Number of industrial enterprises above designated size in Guangdong from 2011 to 2021." Chart. February 13, 2023. Statista. Accessed October 01, 2023. https://www.statista.com/statistics/1033758/industrial-enterprises-number-in-guangdong/
National Bureau of Statistics of China. (2023). Number of industrial enterprises above designated size in Guangdong from 2011 to 2021. Statista. Statista Inc.. Accessed: October 01, 2023. https://www.statista.com/statistics/1033758/industrial-enterprises-number-in-guangdong/
National Bureau of Statistics of China. "Number of Industrial Enterprises above Designated Size in Guangdong from 2011 to 2021." Statista, Statista Inc., 13 Feb 2023, https://www.statista.com/statistics/1033758/industrial-enterprises-number-in-guangdong/
National Bureau of Statistics of China, Number of industrial enterprises above designated size in Guangdong from 2011 to 2021 Statista, https://www.statista.com/statistics/1033758/industrial-enterprises-number-in-guangdong/ (last visited October 01, 2023)
Number of industrial enterprises above designated size in Guangdong from 2011 to 2021 [Graph], National Bureau of Statistics of China, February 13, 2023. [Online]. Available: https://www.statista.com/statistics/1033758/industrial-enterprises-number-in-guangdong/