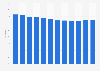
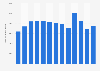
In 2020, a total of approximately 10.7 thousand resale units of landed and non-landed homes (excluding executive condominiums) were sold in Singapore. By 2022, it was estimated to reach 17 thousand. That year, the resale market experienced a significant rise in buyers' interest.
Total number of resale units of landed and non-landed homes sold in Singapore from 2009 to 2020, with estimates until 2022
Basic Account
Get to know the platform
You only have access to basic statistics.
This statistic is not included in your account.
Starter Account
The ideal entry-level account for individual users
- Instant access to 1m statistics
- Download in XLS, PDF & PNG format
- Detailed references
$69 USD $49 USD / Month *
in the first 12 months
Professional Account
Full access
Business Solutions including all features.
* Prices do not include sales tax.
Other statistics that may interest you
Ownership of homes
5
- Basic Statistic Home ownership rate in the UK 2007-2018
- Basic Statistic Homeownership rate in Europe 2021, by country
- Basic Statistic Current position on the residential property market United Kingdom 2017-2020
- Premium Statistic England: share of owner occupied households 2000 to 2022
- Basic Statistic England: homeowner distribution 2022, by home financing and age
Mortgages
8
- Premium Statistic Leading mortgage lenders in the UK 2021, by amount outstanding
- Premium Statistic Leading mortgage lenders in the UK 2020-2022, by gross lending
- Premium Statistic Market share of leading mortgage lenders in the UK 2021, by mortgages outstanding
- Premium Statistic Average mortgage interest rates in the UK 2000-2022
- Premium Statistic Mortgage interest rate in the United Kingdom 2010-2022
- Basic Statistic Quarterly gross mortgage lending in the UK Q4 2018- Q2 2022
- Basic Statistic Monthly development of the value of remortgaging loan approvals in the UK 2010-2022
- Basic Statistic Monthly development of approvals for house purchase lending in the UK 2010-2022
House sales
8
- Premium Statistic Number of housing transactions in the UK 2016-2022, by country
- Basic Statistic Monthly completed house sales volumes in England and Wales 2015-2022
- Premium Statistic Average property asking price in the United Kingdom (UK) Q4 2019, by region
- Premium Statistic Average property asking price in London (UK) Q4 2019, by region
- Premium Statistic Average number of days to sell property in Great Britain 2018-2022
- Premium Statistic Average number of days to sell property in Great Britain 2022, by region
- Premium Statistic Share of high street vs online estate agent transactions in the UK Q2 2022
- Premium Statistic Average stock per estate agent in the UK 2018-2022
Housing stock completions
4
- Premium Statistic UK housing: Total annual housing completions in England Q2 2014-Q4 2019
- Premium Statistic Annual housing completions by private enterprises in England Q4 2014-Q4 2019
- Premium Statistic Quarterly housing completions in past year by associations in England 1979-2020
- Premium Statistic Annual housing completions by local authorities in England Q1 2013 - Q2 2020
Residential property transaction numbers
5
- Premium Statistic Number of residential property transactions in the UK 2006-2022
- Premium Statistic Number of residential property transactions in England 2012-2022
- Premium Statistic Number of residential property transactions in Scotland 2012-2022
- Premium Statistic Number of residential property transactions in Wales 2012-2022
- Premium Statistic Number of residential property transactions in Northern Ireland 2012-2022
First-buyers: property purchase
4
- Basic Statistic Attitude towards buying residential property in the United Kingdom 2016-2022
- Premium Statistic Number of first time buyers in the UK 2008-2022
- Premium Statistic England: average age of first time home buyers from 2005 to 2022
- Premium Statistic First-time buyer mortgage in the UK 2021-2022, by region
Further related statistics
11
- Estimated number of private residential units in Singapore 2016-2025
- Number of units of landed and non-landed homes sold in Singapore 2009-2022
- Total number of HDB resale units in Singapore 2009-2022
- Total number of flats reaching MOP in Singapore 2013-2024
- Estimates number of flats reaching MOP by town in Singapore 2021, by area
- Total launched units of landed and non-landed homes in Singapore 2011-2018
- Total landed houses and freehold apartment units by Perumnas Indonesia 2010-2018
- Sales growth of Billington Structures Limited 2014-2017
- Projected growth in crane and lifting equipment sales 2010-2013
- Total residential housing resales in Prince Edward Island 2014-2021
- Brazil: leading real estate companies 2021, by revenue
Further Content: You might find this interesting as well
Statistics
- Estimated number of private residential units in Singapore 2016-2025
- Number of units of landed and non-landed homes sold in Singapore 2009-2022
- Total number of HDB resale units in Singapore 2009-2022
- Total number of flats reaching MOP in Singapore 2013-2024
- Estimates number of flats reaching MOP by town in Singapore 2021, by area
- Total launched units of landed and non-landed homes in Singapore 2011-2018
- Total landed houses and freehold apartment units by Perumnas Indonesia 2010-2018
- Sales growth of Billington Structures Limited 2014-2017
- Projected growth in crane and lifting equipment sales 2010-2013
- Total residential housing resales in Prince Edward Island 2014-2021
- Brazil: leading real estate companies 2021, by revenue
OrangeTee. (January 14, 2022). Total number of resale units of landed and non-landed homes sold in Singapore from 2009 to 2020, with estimates until 2022 [Graph]. In Statista. Retrieved June 10, 2023, from https://www.statista.com/statistics/1034966/singapore-total-resale-units-landed-non-landed-homes-sold-by-developers/
OrangeTee. "Total number of resale units of landed and non-landed homes sold in Singapore from 2009 to 2020, with estimates until 2022." Chart. January 14, 2022. Statista. Accessed June 10, 2023. https://www.statista.com/statistics/1034966/singapore-total-resale-units-landed-non-landed-homes-sold-by-developers/
OrangeTee. (2022). Total number of resale units of landed and non-landed homes sold in Singapore from 2009 to 2020, with estimates until 2022. Statista. Statista Inc.. Accessed: June 10, 2023. https://www.statista.com/statistics/1034966/singapore-total-resale-units-landed-non-landed-homes-sold-by-developers/
OrangeTee. "Total Number of Resale Units of Landed and Non-landed Homes Sold in Singapore from 2009 to 2020, with Estimates until 2022." Statista, Statista Inc., 14 Jan 2022, https://www.statista.com/statistics/1034966/singapore-total-resale-units-landed-non-landed-homes-sold-by-developers/
OrangeTee, Total number of resale units of landed and non-landed homes sold in Singapore from 2009 to 2020, with estimates until 2022 Statista, https://www.statista.com/statistics/1034966/singapore-total-resale-units-landed-non-landed-homes-sold-by-developers/ (last visited June 10, 2023)
Total number of resale units of landed and non-landed homes sold in Singapore from 2009 to 2020, with estimates until 2022 [Graph], OrangeTee, January 14, 2022. [Online]. Available: https://www.statista.com/statistics/1034966/singapore-total-resale-units-landed-non-landed-homes-sold-by-developers/