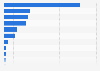
In 2018, Nestle India had the highest relative Nifty price performance of about 23 percent in the Indian FMCG food and beverages and tobacco sector. Nestle has a wide range of products in the food and beverage sector such as milk and nutrition, chocolates and confectionary, beverages and ready-to-eat food.
Relative Nifty price performance of food and beverage and tobacco sector in India in 2018, by company
Basic Account
Get to know the platform
You only have access to basic statistics.
This statistic is not included in your account.
Single Account
The ideal entry-level account for individual users
- Instant access to 1m statistics
- Download in XLS, PDF & PNG format
- Detailed references
$59 $39 / Month *
in the first 12 months
Corporate Account
Full access
Corporate solution including all features.
* Prices do not include sales tax.
Further Content: You might find this interesting as well
Statistics
- Leading FMCG companies in China 2017, based on grocery revenue growth
- Beer market volume share by company India 2017
- Leading FMCG companies in China 2017, based on grocery sales value
- Relative Nifty price performance Indian FMCG home personal care by company 2018
- CJ Corporation's revenue 2010-2021
- Relative price performance Nifty FMCG Index India 2009-2018
- Relative Nifty price performance Dabur India Limited 2009-2018
- Global FMCG industry growth from 2012 to 2016, by revenue size
- Relative Nifty price performance Britannia Industries India 2009-2018
- FMCG industry sale share in the United States in 2016 and 2017, by company size
- Leading global equity index futures and options contracts traded 2021, by volume
- Stock volume index of the wholesale trade sector in the Netherlands 2014-2017
- Revenue of Paulig Group 2016-2021
- Number of retail trade companies in Australia FY 2014 - FY 2020
- Net income of SK Hynix 2015-2021
Nirmal Bang. (December 13, 2018). Relative Nifty price performance of food and beverage and tobacco sector in India in 2018, by company [Graph]. In Statista. Retrieved August 18, 2022, from https://www.statista.com/statistics/1039355/india-relative-nifty-price-performance-food-beverage-tobacco-by-company/
Nirmal Bang. "Relative Nifty price performance of food and beverage and tobacco sector in India in 2018, by company." Chart. December 13, 2018. Statista. Accessed August 18, 2022. https://www.statista.com/statistics/1039355/india-relative-nifty-price-performance-food-beverage-tobacco-by-company/
Nirmal Bang. (2018). Relative Nifty price performance of food and beverage and tobacco sector in India in 2018, by company. Statista. Statista Inc.. Accessed: August 18, 2022. https://www.statista.com/statistics/1039355/india-relative-nifty-price-performance-food-beverage-tobacco-by-company/
Nirmal Bang. "Relative Nifty Price Performance of Food and Beverage and Tobacco Sector in India in 2018, by Company." Statista, Statista Inc., 13 Dec 2018, https://www.statista.com/statistics/1039355/india-relative-nifty-price-performance-food-beverage-tobacco-by-company/
Nirmal Bang, Relative Nifty price performance of food and beverage and tobacco sector in India in 2018, by company Statista, https://www.statista.com/statistics/1039355/india-relative-nifty-price-performance-food-beverage-tobacco-by-company/ (last visited August 18, 2022)