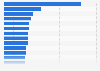
In 2018/19, there were 241 crimes reported by passengers on the London Tramlink. This was the second lowest figure in the period of consideration, following a net decline of 120 crimes. Violence against the person was the most common violation on trams in the city.
Annual number of reported crimes on the Tramlink in London (UK) from 2012/13 to 2018/19*
Profit from the additional features of your individual account
Currently, you are using a shared account. To use individual functions (e.g., mark statistics as favourites, set
statistic alerts) please log in with your personal account.
If you are an admin, please authenticate by logging in again.
Statista Accounts:
Access All Statistics. Starting from $468 / Year
Learn more about how Statista can support your business.
Transport for London. (June 20, 2019). Annual number of reported crimes on the Tramlink in London (UK) from 2012/13 to 2018/19* [Graph]. In Statista. Retrieved August 15, 2022, from https://www.statista.com/statistics/1041705/london-tramlink-total-crimes/
Transport for London. "Annual number of reported crimes on the Tramlink in London (UK) from 2012/13 to 2018/19*." Chart. June 20, 2019. Statista. Accessed August 15, 2022. https://www.statista.com/statistics/1041705/london-tramlink-total-crimes/
Transport for London. (2019). Annual number of reported crimes on the Tramlink in London (UK) from 2012/13 to 2018/19*. Statista. Statista Inc.. Accessed: August 15, 2022. https://www.statista.com/statistics/1041705/london-tramlink-total-crimes/
Transport for London. "Annual Number of Reported Crimes on The Tramlink in London (Uk) from 2012/13 to 2018/19*." Statista, Statista Inc., 20 Jun 2019, https://www.statista.com/statistics/1041705/london-tramlink-total-crimes/
Transport for London, Annual number of reported crimes on the Tramlink in London (UK) from 2012/13 to 2018/19* Statista, https://www.statista.com/statistics/1041705/london-tramlink-total-crimes/ (last visited August 15, 2022)