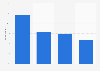
As of 2019, organizations in the Netherlands appeared to be motivated to use online feedback tools by a desire to increase the sense of involvement and engagement of employees, and a wish to encourage requesting and giving feedback within the workplace. Approximately 30 percent of HR professionals surveyed in 2019 indicated that their company used online feedback tools to increase employee involvement. Meanwhile the share of respondents who indicated that their organization was motivated by a desire to keep up with the times and expectations of younger employees was lowest, at roughly 15 percent.
What are the reasons for using online feedback tools in your organization?*
Basic Account
Get to know the platform
You only have access to basic statistics.
This statistic is not included in your account.
Starter Account
The ideal entry-level account for individual users
- Instant access to 1m statistics
- Download in XLS, PDF & PNG format
- Detailed references
$199 USD / Month *
Professional Account
Full access
Business Solutions including all features.
* Prices do not include sales tax.
Other statistics that may interest you Statistics on
About the industry
10
- Basic Statistic Opinions on impact of feedback tools on employee motivation in the Netherlands 2019
- Premium Statistic Top five online feedback tools used in the Netherlands 2019
- Premium Statistic Share of organizations using online tools for mutual feedback in the Netherlands 2019
- Basic Statistic Usage frequency of online tools for mutual feedback in the Netherlands 2019
- Premium Statistic Level of active involvement at work among Japanese women 2020
- Premium Statistic Burnout rates in the Netherlands 2010-2018
- Premium Statistic Share of organizations by training methods given to managers in North America 2019
- Basic Statistic U.S. manufacturing sector productivity quarterly percent change 2020-2023
- Basic Statistic U.S. manufacturing sector unit labor costs quarterly change 2020-2023
- Basic Statistic U.S. manufacturing sector output quarterly percent change 2020-2023
About the region
10
- Premium Statistic Prevalence of employee representation bodies in companies in the Netherlands 2022
- Premium Statistic Share of people who are trade union members in the Netherlands 2022, by age
- Premium Statistic Share of people who are trade union members in the Netherlands 2022, by industry
- Premium Statistic Reasons not to be a trade union member in the Netherlands 2022
- Premium Statistic Number of students in secondary vocational education in the Netherlands 2017-2022
- Basic Statistic Sickness absence rate in the Netherlands 2001-2021
- Premium Statistic Most popular holiday traditions at work in the Netherlands 2019
- Premium Statistic Snacks served at after-work company drinks in the Netherlands 2019
- Premium Statistic Frequency of after-work company drinks in the Netherlands 2019
- Premium Statistic Beverages served at after-work company drinks in the Netherlands 2019
Other regions
10
- Premium Statistic KPIs for onboarding programs worldwide 2019
- Basic Statistic Most used metrics of success for onboarding programs in North America 2017
- Premium Statistic Vietnam: post-purchase online activities 2015
- Premium Statistic Travelers completing feedback surveys worldwide in 2013, by region
- Basic Statistic Influence of reviews and user opinions on consumers in European countries 2013
- Premium Statistic Czech Republic: post-purchase online activities 2015
- Premium Statistic Brazil: post-purchase online activities 2015
- Premium Statistic Slovenia: post-purchase online activities 2015
- Premium Statistic Greece: post-purchase online activities 2015
- Premium Statistic United Kingdom: post-purchase online activities 2015
Related statistics
10
- Premium Statistic Most important reasons to choose an employer in Belgium 2020
- Premium Statistic Share of companies giving employees Christmas boxes in the Netherlands 2015-2019
- Premium Statistic Views on employers prioritizing nationals over immigrants in Belgium 2019
- Premium Statistic Satisfaction with working conditions in the Netherlands 2010-2018
- Premium Statistic Levels of job satisfaction in the Netherlands 2010-2018
- Premium Statistic Reasons not to change jobs in the Netherlands 2019
- Premium Statistic Tracking working hours and attendance in companies in Belgium 2019
- Premium Statistic Tracking working hours and attendance in companies in the Netherlands 2019
- Premium Statistic Reasons to track working hours and attendance in companies in the Netherlands 2019
- Premium Statistic Reasons to track working hours and attendance in companies in Belgium 2019
Further related statistics
10
- Operating income of Tripadvisor worldwide 2008-2023
- Net income of Tripadvisor worldwide 2008-2023
- Leading inverse and leveraged ETPs in the U.S. 2016, by performance
- Factors affecting accommodation booking worldwide as of July 2016
- Importance of management's recognition to job satisfaction of U.S. employees 2015
- Global ITO and BPO - Value of industrywide contracts 2012
- U.S. employees - importance of job security 2012
- U.S. employees - engagement behaviors in the workplace 2012
- U.S. employees - satisfaction with independence and autonomy at workplace 2012
- U.S. employees - satisfaction with career development opportunities 2012
Further Content: You might find this interesting as well
Statistics
- Operating income of Tripadvisor worldwide 2008-2023
- Net income of Tripadvisor worldwide 2008-2023
- Leading inverse and leveraged ETPs in the U.S. 2016, by performance
- Factors affecting accommodation booking worldwide as of July 2016
- Importance of management's recognition to job satisfaction of U.S. employees 2015
- Global ITO and BPO - Value of industrywide contracts 2012
- U.S. employees - importance of job security 2012
- U.S. employees - engagement behaviors in the workplace 2012
- U.S. employees - satisfaction with independence and autonomy at workplace 2012
- U.S. employees - satisfaction with career development opportunities 2012
Statista. (March 7, 2019). What are the reasons for using online feedback tools in your organization?* [Graph]. In Statista. Retrieved April 20, 2024, from https://www.statista.com/statistics/1042168/main-reasons-for-using-online-feedback-tools-in-organizations-in-the-netherlands/
Statista. "What are the reasons for using online feedback tools in your organization?*." Chart. March 7, 2019. Statista. Accessed April 20, 2024. https://www.statista.com/statistics/1042168/main-reasons-for-using-online-feedback-tools-in-organizations-in-the-netherlands/
Statista. (2019). What are the reasons for using online feedback tools in your organization?*. Statista. Statista Inc.. Accessed: April 20, 2024. https://www.statista.com/statistics/1042168/main-reasons-for-using-online-feedback-tools-in-organizations-in-the-netherlands/
Statista. "What Are The Reasons for Using Online Feedback Tools in Your Organization?*." Statista, Statista Inc., 7 Mar 2019, https://www.statista.com/statistics/1042168/main-reasons-for-using-online-feedback-tools-in-organizations-in-the-netherlands/
Statista, What are the reasons for using online feedback tools in your organization?* Statista, https://www.statista.com/statistics/1042168/main-reasons-for-using-online-feedback-tools-in-organizations-in-the-netherlands/ (last visited April 20, 2024)
What are the reasons for using online feedback tools in your organization?* [Graph], Statista, March 7, 2019. [Online]. Available: https://www.statista.com/statistics/1042168/main-reasons-for-using-online-feedback-tools-in-organizations-in-the-netherlands/