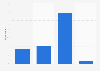
The majority of Australian businesses, 62 percent, did not have any employees in 2018. This indicates that many businesses were self-employed people working for themselves. In Australia, a business that has fewer than 200 employees is categorized as being a small and medium-sized enterprise (SME). Around 98 percent of all Australian businesses fell under this category in 2019.
Distribution of businesses in Australia in 2018, by employment size
Basic Account
Get to know the platform
You only have access to basic statistics.
This statistic is not included in your account.
Starter Account
The ideal entry-level account for individual users
- Instant access to 1m statistics
- Download in XLS, PDF & PNG format
- Detailed references
$149 USD / Month *
Professional Account
Full access
Business Solutions including all features.
* Prices do not include sales tax.
Other statistics that may interest you Statistics on
About the industry
10
- Premium Statistic Share of enterprises obtaining bank overdrafts Australia 2018 by employment size
- Premium Statistic Innovation barriers for enterprises 20 to 199 employees Australia FY 2017
- Premium Statistic Share of enterprises obtaining mortgage loans Australia 2018 by employment size
- Premium Statistic Innovation barriers for enterprises 200 or more employees Australia FY 2017
- Premium Statistic Share of enterprises seeking finance from banks Australia 2018 by employment size
- Premium Statistic Share of enterprises seeking finance Australia 2018 by source
- Premium Statistic Share of enterprises seeking finance from companies Australia 2018 by employment size
- Premium Statistic Share of enterprises seeking finance from owners Australia 2018 by employment size
- Premium Statistic Share of enterprises 0 to 4 employees seeking finance Australia 2018
- Premium Statistic Share of enterprises with less than 20 employees Australia 2018 by industry
About the region
10
- Premium Statistic Survival rate of enterprises Australia 2014-2018 by employment size
- Premium Statistic Share of enterprises seeking finance Australia 2018 by employment size
- Premium Statistic Share of enterprises obtaining debt finance Australia 2018 by employment size
- Premium Statistic Share of enterprises obtaining credit card finance Australia 2018 by employment size
- Premium Statistic Share of enterprises 5 to 19 employees seeking finance Australia 2018
- Premium Statistic Share of enterprises 20 to 199 employees seeking finance Australia 2018
- Premium Statistic Share of enterprises 200 or more employees seeking finance Australia 2018
- Premium Statistic Innovation barriers for enterprises 0 to 4 employees Australia FY 2017
- Premium Statistic Innovation barriers for enterprises 5 to 19 employees Australia FY 2017
- Premium Statistic Business exit reasons in Australia 2017
Other regions
10
- Premium Statistic Number of internet literature writers in China 2015-2022
- Premium Statistic Quarterly employed labor force in Italy 2019-2020
- Premium Statistic Plans to hire new staff in startups in Russia 2021
- Premium Statistic Numbers of programmers and software developers in the United Kingdom (UK) 2011-2021
- Basic Statistic COVID-19: experience with telework in confinement in Spain 2020
- Premium Statistic Self-employment share in MENA by country 2010
- Premium Statistic Challenges of increased flexibilization on the job market in the Netherlands 2017
- Premium Statistic Early stage entrepreneur share in India 2017, by age group
- Premium Statistic Business exit reasons in Indonesia 2018
- Premium Statistic Number of full-time self-employed workers in the tourism sector Egypt 2010-2015
Related statistics
10
- Premium Statistic Self-employed job stress New Zealand 2018 by frequency
- Premium Statistic Employees with paid leave entitlement by type New Zealand 2018
- Premium Statistic Early stage entrepreneur share in Australia 2017, by age group
- Premium Statistic Quarterly number of real estate full-time employees New Zealand 2017-2022
- Premium Statistic Share of workforce in Australia 2022 by employment profile
- Premium Statistic Share of workforce in Australia 2022 by qualification level
- Premium Statistic Share of fintech companies Australia 2020, by end customer
- Premium Statistic Share of fintech companies Australia 2016-2020, by company age
- Premium Statistic Share of fintech companies Australia 2023, by HQ location
- Premium Statistic Share of fintech companies Australia 2019-2020, by type
Further related statistics
10
- Number of Rio Tinto's employees 2010-2022
- Number of CBRE Group employees 2009-2022
- Main employment centers of HSBC in 2022, by number of employees
- Biofuels related jobs worldwide by region 2019
- Number of waiters and waitresses in the restaurant industry in the U.S. 2010-2026
- Number of food-preparation workers in the restaurant industry in the U.S. 2010-2026
- Number of bartenders employed in the restaurant industry in the U.S. 2010-2026
- Reasons restaurant employees took a break from the industry in the U.S. as of 2013
- John Lewis Partnership: number of employees in the United Kingdom (UK) 2009-2023
- Number of employees of the adidas Group worldwide from 2000 to 2022
Further Content: You might find this interesting as well
Statistics
- Number of Rio Tinto's employees 2010-2022
- Number of CBRE Group employees 2009-2022
- Main employment centers of HSBC in 2022, by number of employees
- Biofuels related jobs worldwide by region 2019
- Number of waiters and waitresses in the restaurant industry in the U.S. 2010-2026
- Number of food-preparation workers in the restaurant industry in the U.S. 2010-2026
- Number of bartenders employed in the restaurant industry in the U.S. 2010-2026
- Reasons restaurant employees took a break from the industry in the U.S. as of 2013
- John Lewis Partnership: number of employees in the United Kingdom (UK) 2009-2023
- Number of employees of the adidas Group worldwide from 2000 to 2022
Australian Banking Association. (August 30, 2019). Distribution of businesses in Australia in 2018, by employment size [Graph]. In Statista. Retrieved December 09, 2023, from https://www.statista.com/statistics/1047556/australia-share-of-companies-by-employee-numbers/
Australian Banking Association. "Distribution of businesses in Australia in 2018, by employment size." Chart. August 30, 2019. Statista. Accessed December 09, 2023. https://www.statista.com/statistics/1047556/australia-share-of-companies-by-employee-numbers/
Australian Banking Association. (2019). Distribution of businesses in Australia in 2018, by employment size. Statista. Statista Inc.. Accessed: December 09, 2023. https://www.statista.com/statistics/1047556/australia-share-of-companies-by-employee-numbers/
Australian Banking Association. "Distribution of Businesses in Australia in 2018, by Employment Size." Statista, Statista Inc., 30 Aug 2019, https://www.statista.com/statistics/1047556/australia-share-of-companies-by-employee-numbers/
Australian Banking Association, Distribution of businesses in Australia in 2018, by employment size Statista, https://www.statista.com/statistics/1047556/australia-share-of-companies-by-employee-numbers/ (last visited December 09, 2023)
Distribution of businesses in Australia in 2018, by employment size [Graph], Australian Banking Association, August 30, 2019. [Online]. Available: https://www.statista.com/statistics/1047556/australia-share-of-companies-by-employee-numbers/