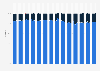
According to an August 2018 report on unlocking behavior among smartphone users in the United States, more than 50 percent of first apps used within an unlock session are closed after less than 10 seconds. During the measured period, only 1 percent of first apps are closed after 10 to 30 minutes of use.
Duration of first app use within an unlock session among smartphone users in the United States as of August 2018
Basic Account
Get to know the platform
You only have access to basic statistics.
This statistic is not included in your account.
Starter Account
The ideal entry-level account for individual users
- Instant access to 1m statistics
- Download in XLS, PDF & PNG format
- Detailed references
$229 USD $199 USD / Month *
in the first 12 months
Professional Account
Full access
Business Solutions including all features.
* Prices do not include sales tax.
Other statistics that may interest you Statistics on
About the industry
10
- Basic Statistic Length of unlock sessions among U.S. smartphone users 2018
- Premium Statistic Distribution of push notifications among U.S. smartphone users 2018
- Premium Statistic Average monthly smartphone unlock session per unique user U.S. 2019, by vertical
- Basic Statistic Unlock engagement ratio of leading mobile apps in the U.S. 2018
- Basic Statistic Distribution of direct smartphone app unlocks among U.S. users 2018, by session type
- Premium Statistic First app sessions under 10 seconds among U.S. smartphone users 2018, by type
- Premium Statistic Average hourly unlocks among U.S. smartphone users 2018
- Basic Statistic Percentage of time spent from first app visit among U.S. smartphone users 2018
- Basic Statistic Distribution of mobile unlocks among U.S. smartphone users 2018, by landing
- Basic Statistic Fastest growing mobile app categories 2018
About the region
10
- Basic Statistic Average daily unlocks among U.S. smartphone users 2018, by generation
- Premium Statistic U.S. mobile users that get annoyed by app push notifications 2017, by age group
- Basic Statistic Most popular smartphone activities in the United States 2018, by frequency
- Premium Statistic U.S. mobile users that allow app push notifications 2015-2017
- Premium Statistic US mobile users that allow app push notifications 2017, by age group
- Premium Statistic United States: smartphone activities 2015
- Premium Statistic Leading Android shopping app reach in the United States 2019
- Premium Statistic Leading iOS shopping app reach in the United States 2019
- Premium Statistic Number of U.S. mobile-only social network users 2017-2021
- Basic Statistic U.S. iOS million dollar app publishers category focus 2018
Other regions
10
- Premium Statistic Mobile phone usage in Finland 2022
- Premium Statistic Acceptance of mobile ads among Android and iOS users in China in 2012
- Premium Statistic Telephone types used by children in Poland 2022
- Premium Statistic Netherlands: smartphone activities 2015
- Premium Statistic Brazil: smartphone activities 2015
- Premium Statistic Singapore: smartphone activities 2015
- Premium Statistic Greece: smartphone activities 2015
- Premium Statistic Vietnam: smartphone activities 2015
- Premium Statistic Mexico: smartphone activities 2015
- Premium Statistic Bulgaria: smartphone activities 2015
Related statistics
10
- Premium Statistic Share of French people leaving their mobile phone on at night 2019
- Premium Statistic Video call services use during COVID-19 pandemic in the U.S. 2020
- Premium Statistic Share of French people surfing the Internet with a mobile 2019, by place of residence
- Basic Statistic Growing influence of online tech and its impact on people's lives worldwide 2018
- Premium Statistic Share of U.S. location-based service users 2015, by ethnicity
- Premium Statistic France: mobile app usage to make voice calls 2014-2022
- Premium Statistic France home internet usage 2011-2022, by device and type of connection
- Premium Statistic Countries with highest mobile malware encounter rate Q3 2022
- Premium Statistic Annual growth of key digital indicators in Sweden 2022
- Basic Statistic Average daily mobile internet usage in Canada 2020, by language
Further related statistics
10
- Number of China Unicom mobile subscriptions 2012-2022
- U.S. cell phone owners who use mobile banking 2013, by ethnicity
- Device usage among children to consume media in the United Kingdom (UK) 2013-2019
- Apple iPhone sales worldwide 2007-2018
- Podcast consumption on mobile in the U.S. 2017
- Use of mobile devices to make restaurant reservations in the U.S. 2014, by age group
- Leading trends in technology in restaurants in the U.S. 2015*
- Smartphone share of handset unit sales in the United Kingdom (UK) 2010-2013
- Survey: ownership of mobile devices by U.S. American adults 2011-2012
- BlackBerry net income/loss 2009-2023
Further Content: You might find this interesting as well
Statistics
- Number of China Unicom mobile subscriptions 2012-2022
- U.S. cell phone owners who use mobile banking 2013, by ethnicity
- Device usage among children to consume media in the United Kingdom (UK) 2013-2019
- Apple iPhone sales worldwide 2007-2018
- Podcast consumption on mobile in the U.S. 2017
- Use of mobile devices to make restaurant reservations in the U.S. 2014, by age group
- Leading trends in technology in restaurants in the U.S. 2015*
- Smartphone share of handset unit sales in the United Kingdom (UK) 2010-2013
- Survey: ownership of mobile devices by U.S. American adults 2011-2012
- BlackBerry net income/loss 2009-2023
Verto Analytics. (April 24, 2019). Duration of first app use within an unlock session among smartphone users in the United States as of August 2018 [Graph]. In Statista. Retrieved October 02, 2023, from https://www.statista.com/statistics/1050360/first-app-used-within-unlock-session-duration/
Verto Analytics. "Duration of first app use within an unlock session among smartphone users in the United States as of August 2018." Chart. April 24, 2019. Statista. Accessed October 02, 2023. https://www.statista.com/statistics/1050360/first-app-used-within-unlock-session-duration/
Verto Analytics. (2019). Duration of first app use within an unlock session among smartphone users in the United States as of August 2018. Statista. Statista Inc.. Accessed: October 02, 2023. https://www.statista.com/statistics/1050360/first-app-used-within-unlock-session-duration/
Verto Analytics. "Duration of First App Use within An Unlock Session among Smartphone Users in The United States as of August 2018." Statista, Statista Inc., 24 Apr 2019, https://www.statista.com/statistics/1050360/first-app-used-within-unlock-session-duration/
Verto Analytics, Duration of first app use within an unlock session among smartphone users in the United States as of August 2018 Statista, https://www.statista.com/statistics/1050360/first-app-used-within-unlock-session-duration/ (last visited October 02, 2023)
Duration of first app use within an unlock session among smartphone users in the United States as of August 2018 [Graph], Verto Analytics, April 24, 2019. [Online]. Available: https://www.statista.com/statistics/1050360/first-app-used-within-unlock-session-duration/