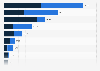
Between September 2018 and August 2019, hotels were the tourist facilities in Italy receiving most online reviews. According to the data, they received 69 percent of all online reviews on tourist facilities in Italy with an active presence online. By contrast, agritourism facilities only received four percent of online reviews on tourist facilities in Italy in the considered period.
Distribution of online reviews on tourist facilities in Italy between September 2018 and August 2019, by facility
Basic Account
Get to know the platform
You only have access to basic statistics.
This statistic is not included in your account.
Single Account
The ideal entry-level account for individual users
- Instant access to 1m statistics
- Download in XLS, PDF & PNG format
- Detailed references
$59 $39 / Month *
in the first 12 months
Corporate Account
Full access
Corporate solution including all features.
* Prices do not include sales tax.
Further Content: You might find this interesting as well
Statistics
- Share of tourist facilities with an online presence in Italy 2019-2020, by type
- Satisfaction level with tourist facilities in Italy 2019-2020, by service
- Share of outdoor experiences' online adverts in Italy 2018-2019, by experience
- Number of overnight stays in hotels on the Reunion Island 2014-2017
- Distribution of hotel stays in French Polynesia by country of residence 2017
- Hotel revenue in the Emirate of Abu Dhabi by region 2018
- Number of hotel guests in the Emirate of Abu Dhabi by region 2018
- Importance of guest reviews to hotel companies worldwide as of October 2014
- Most popular countries as of June 2014, by average guest hotel rating
- Most positively-rated U.S. cities for 4-star hotels as of May 2014
- Importance of integrating guest reviews and hotel ratings to OTAs worldwide in 2014*
- Most popular U.S. cities as of June 2014, by average guest hotel rating
- Most positively-rated U.S. cities for 3-star hotels as of May 2014
- Occupancy rate of hotels in the Emirate of Abu Dhabi by region 2018
- International tourist arrivals forecast in the Dominican Republic 2010-2025
- Tourism sector GDP share forecast in Central Africa 2010-2025
- Tourism sector GDP share forecast in Guatemala 2010-2025
- International tourism expenditure forecast in Senegal 2010-2025
Travel Appeal. (October 10, 2019). Distribution of online reviews on tourist facilities in Italy between September 2018 and August 2019, by facility [Graph]. In Statista. Retrieved April 21, 2021, from https://www.statista.com/statistics/1061075/share-of-online-reviews-on-tourist-facilities-in-italy-by-facility/
Travel Appeal. "Distribution of online reviews on tourist facilities in Italy between September 2018 and August 2019, by facility." Chart. October 10, 2019. Statista. Accessed April 21, 2021. https://www.statista.com/statistics/1061075/share-of-online-reviews-on-tourist-facilities-in-italy-by-facility/
Travel Appeal. (2019). Distribution of online reviews on tourist facilities in Italy between September 2018 and August 2019, by facility. Statista. Statista Inc.. Accessed: April 21, 2021. https://www.statista.com/statistics/1061075/share-of-online-reviews-on-tourist-facilities-in-italy-by-facility/
Travel Appeal. "Distribution of Online Reviews on Tourist Facilities in Italy between September 2018 and August 2019, by Facility." Statista, Statista Inc., 10 Oct 2019, https://www.statista.com/statistics/1061075/share-of-online-reviews-on-tourist-facilities-in-italy-by-facility/
Travel Appeal, Distribution of online reviews on tourist facilities in Italy between September 2018 and August 2019, by facility Statista, https://www.statista.com/statistics/1061075/share-of-online-reviews-on-tourist-facilities-in-italy-by-facility/ (last visited April 21, 2021)