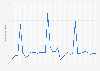
The value of metal products shipped in Russia in August 2020 was 657 billion Russian rubles, the highest figure for the observed period. To compare, in August 2019, shipped metal products were worth 581 billion Russian rubles.
Value of shipped metal products in Russia from January 2019 to August 2020 (in billion Russian rubles)
Basic Account
Get to know the platform
You only have access to basic statistics.
This statistic is not included in your account.
Starter Account
The ideal entry-level account for individual users
- Instant access to 1m statistics
- Download in XLS, PDF & PNG format
- Detailed references
$149 USD / Month *
Professional Account
Full access
Business Solutions including all features.
* Prices do not include sales tax.
Other statistics that may interest you Statistics on
About the industry
10
- Premium Statistic Leading metallurgical companies in Russia in H1 2020, by revenue
- Premium Statistic EBITDA of leading metallurgical companies in Russia 2020
- Premium Statistic Leading steel companies in Russia 2022, by production
- Premium Statistic Global steel industry - Nucor Corporation's revenue 2006-2022
- Premium Statistic Steel production volume in Russia monthly 2021-2023
- Premium Statistic Liquid steel production for castings in the United Kingdom (UK) from 2009 to 2021
- Premium Statistic Exports of pig iron in the United Kingdom 2009-2021
- Premium Statistic Imports of pig iron in the United Kingdom 2009-2021
- Premium Statistic Imports of direct reduced iron in the United Kingdom (UK) 2009-2021
- Premium Statistic Monthly iron and steel manufacturing GDP in Canada 2021
About the region
10
- Premium Statistic Steel export value in Russia 2021, by product
- Premium Statistic Steel mill import value in Russia 2021, by product
- Premium Statistic Steel export volume in Russia 2020, by destination
- Premium Statistic Steel import value in Russia 2020-2021, by country
- Premium Statistic Steel export value in Russia 2020-2021, by destination
- Premium Statistic True steel use in Russia 2010-2019
- Premium Statistic True steel use (TSU) per capita in Russia 2008-2018
- Basic Statistic Continuously-cast steel output in Russia 2016-2022
- Premium Statistic Direct reduced iron production 2011-2022
- Premium Statistic Steel scrap exports from Russia 2021, by country
Selected statistics
3
Other regions
10
- Premium Statistic Monthly production of crude steel in the United Kingdom (UK) 2021
- Premium Statistic Nucor's net sales by product category 2021
- Premium Statistic Revenue of Chinese steelmaker Jianlong Group 2015-2019
- Premium Statistic Tata Steel's Research and Development spending FY 2013-2023
- Premium Statistic High-carbon steel wire rods production volume in Japan 2013-2022
- Premium Statistic Italy: opinion on Ilva dismantlement 2018
- Premium Statistic Production volume of stainless steel in Europe 2013-2018
- Premium Statistic Iron and steel industry in the United States - employment 2013-2019
- Premium Statistic Production of hot rolled steel products in Poland from 2009 to 2019
- Premium Statistic EU-28: production output of hot rolled bars by leading country 2010-2021
Related statistics
9
- Premium Statistic Apparent steel use per capita in Russia 2018-2022
- Basic Statistic Semi-finished and finished steel product export volume in Russia 2009-2021
- Basic Statistic Semi-finished and finished steel product import volume in Russia 2009-2021
- Basic Statistic Hot rolled steel products production in Russia 2009-2019
- Basic Statistic Hot-rolled steel products production in Ukraine 2009-2019
- Premium Statistic Trade value of zinc dust, powder, and flakes in Russia 2012-2022
- Premium Statistic Russian export distribution in 2021, by destination and product
- Premium Statistic Import distribution in Russia 2021, by origin and product
- Premium Statistic Rusal's revenue 2020-2022, by segment
Further related statistics
7
- Number of Rio Tinto's employees 2010-2022
- Rio Tinto's aluminum and copper production 2010-2022
- Comparison of cobalt consumption in the U.S. 2010-2022
- Iron ore prices 2000-2022
- Thermal coal prices 2013-2022
- Percentage of metals in U.S. municipal solid waste generation 1960-2014
- Rare earths demand growth rates for specific industry sectors 2010-2015
Further Content: You might find this interesting as well
Statistics
- Number of Rio Tinto's employees 2010-2022
- Rio Tinto's aluminum and copper production 2010-2022
- Comparison of cobalt consumption in the U.S. 2010-2022
- Iron ore prices 2000-2022
- Thermal coal prices 2013-2022
- Percentage of metals in U.S. municipal solid waste generation 1960-2014
- Rare earths demand growth rates for specific industry sectors 2010-2015
Deloitte. (December 1, 2020). Value of shipped metal products in Russia from January 2019 to August 2020 (in billion Russian rubles) [Graph]. In Statista. Retrieved December 05, 2023, from https://www.statista.com/statistics/1079885/russia-shipped-metal-products-value/
Deloitte. "Value of shipped metal products in Russia from January 2019 to August 2020 (in billion Russian rubles)." Chart. December 1, 2020. Statista. Accessed December 05, 2023. https://www.statista.com/statistics/1079885/russia-shipped-metal-products-value/
Deloitte. (2020). Value of shipped metal products in Russia from January 2019 to August 2020 (in billion Russian rubles). Statista. Statista Inc.. Accessed: December 05, 2023. https://www.statista.com/statistics/1079885/russia-shipped-metal-products-value/
Deloitte. "Value of Shipped Metal Products in Russia from January 2019 to August 2020 (in Billion Russian Rubles)." Statista, Statista Inc., 1 Dec 2020, https://www.statista.com/statistics/1079885/russia-shipped-metal-products-value/
Deloitte, Value of shipped metal products in Russia from January 2019 to August 2020 (in billion Russian rubles) Statista, https://www.statista.com/statistics/1079885/russia-shipped-metal-products-value/ (last visited December 05, 2023)
Value of shipped metal products in Russia from January 2019 to August 2020 (in billion Russian rubles) [Graph], Deloitte, December 1, 2020. [Online]. Available: https://www.statista.com/statistics/1079885/russia-shipped-metal-products-value/