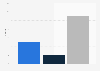
Share of Russians trying to eat only healthy food in 2018, by age
The lowest share of Russians that try to eat only naturally healthy food was recorded among respondents between 20 and 24 years old, measuring at 35 percent. According to IPSOS RosIndex 2018, more than one half of the elderly population aged 65 years and older wanted to implement healthy nutrition in their lifestyle.