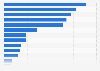
Consumers in the United States spent the most on pet care worldwide in 2019 - Americans spent 162 U.S. dollars on a per capita basis on such products in that year. Britain ranked in distant second place, where consumers on average spent 93 U.S. dollars per capita.
Average expenditure on pet care products per capita in select countries worldwide in 2019 (in U.S. dollars)
Basic Account
Get to know the platform
You only have access to basic statistics.
This statistic is not included in your account.
Starter Account
The ideal entry-level account for individual users
- Instant access to 1m statistics
- Download in XLS, PDF & PNG format
- Detailed references
$69 USD $49 USD / Month *
in the first 12 months
Professional Account
Full access
Business Solutions including all features.
* Prices do not include sales tax.
Other statistics that may interest you
Market overview
5
- Premium Statistic Sales of pet food worldwide 2010-2022
- Premium Statistic Pet food production worldwide 2022, by region
- Premium Statistic Global pet food production growth by region 2022
- Premium Statistic Pet products and pet services value in Europe 2010-2021
- Premium Statistic Pet food industry employment in Europe 2010-2021
Pet ownership
8
- Premium Statistic Number of pet owning households in Europe 2010-2021
- Basic Statistic Pet population in the European Union 2021, by animal type
- Premium Statistic Number of dogs in Europe 2010-2021
- Basic Statistic Number of dogs in the European Union 2021, by country
- Basic Statistic Dog ownership in the European Union 2021, by country
- Premium Statistic Number of cats in Europe 2010-2021
- Basic Statistic Number of cats in the European Union 2021, by country
- Basic Statistic Cat ownership in the European Union 2021, by country
Pet food
8
- Premium Statistic Annual revenue of leading pet food companies Europe 2021
- Premium Statistic European Union: sales of leading pet food brands 2020
- Premium Statistic Pet food sales turnover in Europe 2010-2021
- Premium Statistic Pet food sales volume in Europe 2010-2021
- Premium Statistic Pet food industry growth rate in Europe 2010-2021
- Premium Statistic Pet food sales in the EU-28 2020, by category
- Premium Statistic Distribution of pet food sales in the EU-28 2020
- Premium Statistic What consumers feed their pet in Europe 2021, by diet type
Retail and trade
5
- Premium Statistic Pets at Home revenue in the United Kingdom (UK) 2011-2022
- Premium Statistic Number of Pets at Home stores in the United Kingdom (UK) 2013-2022
- Premium Statistic Online revenue of Fressnapf in Germany 2012-2021
- Premium Statistic Value of imported cat and dog food in the EU 2011-2021
- Premium Statistic Value of exported cat and dog food from the EU 2011-2021
Further related statistics
17
- Weekly household expenditure on pets in Ireland 2015, by cost type
- Pet care market value in the United Kingdom (UK) 2021, by category
- Pet care retail market distribution in Russia 2016, by channel
- Average annual pet expenses in Denmark 2017, by type of pet
- Pet care market value in the United Kingdom (UK) 2008-2021
- Chile: pet care industry value in 2017-2022
- Latin America: pet care sales growth 2011-2016, by country
- Pet market growth rate in the UK 2021, by category
- Online pet products market value in the United Kingdom (UK) 2014, by delivery type
- Households' yearly spending on pets in China 2016, by expenditure range
- China's pet food market size 2015-2023
- Pet supplies: per capita spending in Europe 2013, by country
- Leading pet care retailers ranked by market share in the United Kingdom (UK) 2014
- Pet supplies market size in Japan FY 2017-2024
- China's pet medical care market size 2012-2018
- Most important pet retailers in Romania 2020, by market share
- Sales value of dog food in Poland 2014-2023
Further Content: You might find this interesting as well
Statistics
- Weekly household expenditure on pets in Ireland 2015, by cost type
- Pet care market value in the United Kingdom (UK) 2021, by category
- Pet care retail market distribution in Russia 2016, by channel
- Average annual pet expenses in Denmark 2017, by type of pet
- Pet care market value in the United Kingdom (UK) 2008-2021
- Chile: pet care industry value in 2017-2022
- Latin America: pet care sales growth 2011-2016, by country
- Pet market growth rate in the UK 2021, by category
- Online pet products market value in the United Kingdom (UK) 2014, by delivery type
- Households' yearly spending on pets in China 2016, by expenditure range
- China's pet food market size 2015-2023
- Pet supplies: per capita spending in Europe 2013, by country
- Leading pet care retailers ranked by market share in the United Kingdom (UK) 2014
- Pet supplies market size in Japan FY 2017-2024
- China's pet medical care market size 2012-2018
- Most important pet retailers in Romania 2020, by market share
- Sales value of dog food in Poland 2014-2023
Statista. (May 6, 2020). Average expenditure on pet care products per capita in select countries worldwide in 2019 (in U.S. dollars) [Graph]. In Statista. Retrieved May 31, 2023, from https://www.statista.com/statistics/1115339/pet-care-spending-per-capita-worldwide/
Statista. "Average expenditure on pet care products per capita in select countries worldwide in 2019 (in U.S. dollars)." Chart. May 6, 2020. Statista. Accessed May 31, 2023. https://www.statista.com/statistics/1115339/pet-care-spending-per-capita-worldwide/
Statista. (2020). Average expenditure on pet care products per capita in select countries worldwide in 2019 (in U.S. dollars). Statista. Statista Inc.. Accessed: May 31, 2023. https://www.statista.com/statistics/1115339/pet-care-spending-per-capita-worldwide/
Statista. "Average Expenditure on Pet Care Products per Capita in Select Countries Worldwide in 2019 (in U.S. Dollars)." Statista, Statista Inc., 6 May 2020, https://www.statista.com/statistics/1115339/pet-care-spending-per-capita-worldwide/
Statista, Average expenditure on pet care products per capita in select countries worldwide in 2019 (in U.S. dollars) Statista, https://www.statista.com/statistics/1115339/pet-care-spending-per-capita-worldwide/ (last visited May 31, 2023)
Average expenditure on pet care products per capita in select countries worldwide in 2019 (in U.S. dollars) [Graph], Statista, May 6, 2020. [Online]. Available: https://www.statista.com/statistics/1115339/pet-care-spending-per-capita-worldwide/