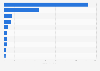
Almost 40 percent of French people consumed pizza directly at home. In about 20 percent of the cases they bought them and baked them at home. In comparison, 33 percent of consumers ate pizza at the table restaurant (23 percent) or fast food restaurant (ten percent).
Distribution of the pizza market share in France in 2017, by consumer hub
Basic Account
Get to know the platform
You only have access to basic statistics.
This statistic is not included in your account.
Starter Account
The ideal entry-level account for individual users
- Instant access to 1m statistics
- Download in XLS, PDF & PNG format
- Detailed references
$149 USD / Month *
Professional Account
Full access
Business Solutions including all features.
* Prices do not include sales tax.
Other statistics that may interest you Statistics on
About the industry
10
- Premium Statistic Brazil: most popular food types during COVID-19
- Premium Statistic Preferred places for having dinner out of home in Italy 2019
- Premium Statistic Frequency of food orders in Poland 2019
- Premium Statistic Average pizza prices in pizzerias in Sweden in 2018, by city
- Premium Statistic Share of Americans who visited Domino's 2018, by age
- Premium Statistic Distribution of fast food restaurants that customers go to in Belgium in 2018
- Premium Statistic Frequency of going to fast food restaurants in Denmark 2017
- Premium Statistic Mexico: no. of transactions of food delivery apps 2011-2021
- Premium Statistic Revenue of food delivery apps in Mexico 2011-2021
- Premium Statistic Share of coffee consumers in China 2016, by gender
About the region
10
- Premium Statistic Leading 'Pizzas (Excluding Takeaway)' brands in FR 2016 - 2022, by number of consumers
- Premium Statistic Types of meals ordered on home delivery apps during the confinement in France 2020
- Premium Statistic Leading e-commerce delivery methods used in France 2023
- Premium Statistic Sales value of fresh butcher's meat in France 2021, by kind of meat
- Premium Statistic Average price fresh butcher's meat in France 2021, by type of meat
- Premium Statistic 'Pizzas (Excluding Takeaway)' consumption in FR 2016 - 2022, by type
- Premium Statistic Reasons motivating French people to eat fish in 2021
- Premium Statistic Frequency of ordering takeout food via click and collect in France 2021
- Premium Statistic Restaurant choice criteria for ordering delivery meals or takeaways in France in 2021
- Premium Statistic Number of Pizza Hut restaurants in France 2021, by city
Other regions
9
- Premium Statistic Domino's Pizza advertising spending in the U.S. 2009-2022
- Premium Statistic Average household expenditure on pizza and quiche in Denmark 2010-2021
- Premium Statistic 'Pizzas (Excluding Takeaway)' consumption in GB 2016 - 2022, by type
- Premium Statistic Frozen pizza consumption frequency in Germany in 2020, by household size
- Premium Statistic Revenue by segment of Domino's Pizza 2013-2022, by segment
- Premium Statistic Market size of prepared pizza South Korea 2011-2021
- Premium Statistic Restaurants connected to Lieferservice.at in Austria 2014-2019
- Premium Statistic Restaurants connected to Takeaway.com in Belgium 2014-2019
- Premium Statistic Preferred places for having lunch out of home in Italy during weekdays 2019
Related statistics
10
- Premium Statistic Restaurants connected to Thuisbezorgd.nl in the Netherlands 2014-2020
- Premium Statistic Brand awareness in the Netherlands and Germany of Just Eat Takeaway.com 2018-2020
- Premium Statistic Situations that favor online food orders according to French people in France 2020
- Premium Statistic Common foods ordered by Deliveroo users in France 2020
- Premium Statistic Amount spent on home delivery applications in France 2020
- Premium Statistic Reasons for the use of food delivery applications in France 2020
- Premium Statistic Revenue of food deliveries in the Netherlands in H1 2017 and H1 2018, by type of meal
- Premium Statistic Leading food delivery companies in the Netherlands 2016, by turnover
- Premium Statistic Frequency at which French students use food delivery services 2017
- Premium Statistic Change in the budget for restaurant outings in France 2016-2017
Further related statistics
10
- Revenue of Papa John's worldwide 2007-2022
- Number of Papa John's restaurants in the U.S. 2007-2022, by mode of operation
- Operating income of Papa John's worldwide 2007-2022
- Net income of Papa John's worldwide 2007-2022
- Number of Papa John's restaurants in China 2007-2022, by mode of operation
- General and administrative expenses of Domino's Pizza worldwide 2006-2022
- Furniture shopping: Consumers' delivery preferences in the United Kingdom (UK) 2013
- Coal consumption in South Africa 1998-2022
- Number of Wendy's restaurants worldwide 2011-2022, by mode of operation
- Total assets of Wendy's 2009-2022
Further Content: You might find this interesting as well
Statistics
- Revenue of Papa John's worldwide 2007-2022
- Number of Papa John's restaurants in the U.S. 2007-2022, by mode of operation
- Operating income of Papa John's worldwide 2007-2022
- Net income of Papa John's worldwide 2007-2022
- Number of Papa John's restaurants in China 2007-2022, by mode of operation
- General and administrative expenses of Domino's Pizza worldwide 2006-2022
- Furniture shopping: Consumers' delivery preferences in the United Kingdom (UK) 2013
- Coal consumption in South Africa 1998-2022
- Number of Wendy's restaurants worldwide 2011-2022, by mode of operation
- Total assets of Wendy's 2009-2022
CHD Expert. (December 13, 2017). Distribution of the pizza market share in France in 2017, by consumer hub [Graph]. In Statista. Retrieved December 11, 2023, from https://www.statista.com/statistics/1119284/pizza-market-consumption-places-in-france/
CHD Expert. "Distribution of the pizza market share in France in 2017, by consumer hub." Chart. December 13, 2017. Statista. Accessed December 11, 2023. https://www.statista.com/statistics/1119284/pizza-market-consumption-places-in-france/
CHD Expert. (2017). Distribution of the pizza market share in France in 2017, by consumer hub. Statista. Statista Inc.. Accessed: December 11, 2023. https://www.statista.com/statistics/1119284/pizza-market-consumption-places-in-france/
CHD Expert. "Distribution of The Pizza Market Share in France in 2017, by Consumer Hub." Statista, Statista Inc., 13 Dec 2017, https://www.statista.com/statistics/1119284/pizza-market-consumption-places-in-france/
CHD Expert, Distribution of the pizza market share in France in 2017, by consumer hub Statista, https://www.statista.com/statistics/1119284/pizza-market-consumption-places-in-france/ (last visited December 11, 2023)
Distribution of the pizza market share in France in 2017, by consumer hub [Graph], CHD Expert, December 13, 2017. [Online]. Available: https://www.statista.com/statistics/1119284/pizza-market-consumption-places-in-france/