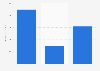
Revenue per available room (RevPAR) of hotels in Florence 2014-2019
From 2014 to 2019, the revenue per available room (RevPAR) of hotels in Florence increased steadily. In 2014, the RevPAR of hotels in this Italian city reached 107.5 euros. In 2019, the RevPAR peaked at 135 euros. The revenue per available room is a metric used in the hotel industry to understand the profitability of an accommodation. It is calculated by dividing the total revenues with the total number of available rooms in a specific period of time.