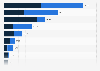
This statistic presents the number of nights spent in hotels in the Auvergne-Rhône-Alpes region in France between 2013 and 2019. During that period, the number of overnight stays in the region generally increased, reaching an all time high of 24.1 million nights spent in hotels in 2019.
Number of nights spent in hotels in the Auvergne-Rhône-Alpes region in France from 2013 to 2019 (in million)
Basic Account
Get to know the platform
You only have access to basic statistics.
This statistic is not included in your account.
Starter Account
The ideal entry-level account for individual users
- Instant access to 1m statistics
- Download in XLS, PDF & PNG format
- Detailed references
$229 USD $199 USD / Month *
in the first 12 months
Professional Account
Full access
Business Solutions including all features.
* Prices do not include sales tax.
Other statistics that may interest you Statistics on
About the industry
10
- Premium Statistic Hotels overnight stays in Auvergne-Rhône-Alpes, France 2018, by area
- Premium Statistic Domestic hotel overnight stays in Auvergne-Rhône-Alpes, France 2013-2018
- Premium Statistic International hotel overnight stays in Auvergne-Rhône-Alpes, France 2013-2018
- Premium Statistic Number of hotels in Auvergne-Rhône-Alpes, France 2013-2018
- Premium Statistic Overnight stays in hotels in Grand Est, France 2018, by origin
- Premium Statistic Share of overnight stays in hotels in Grand Est, France 2018, by destination
- Premium Statistic Revenue per room available excluding taxes in Grand Est, France 2018, by destination
- Premium Statistic Revenue per available room (RevPAR) of hotels in Milan 2014-2019
- Premium Statistic Average daily rate (ADR) of hotels in selected cities in Italy 2019
- Premium Statistic Average daily rate (ADR) of hotels in Venice 2014-2019
About the region
10
- Premium Statistic Overnight stays at camping sites in Auvergne-Rhône-Alpes, France 2013-2018
- Premium Statistic Camping site overnight stays in Auvergne-Rhône-Alpes, France 2013-2018, by origin
- Premium Statistic Employment in the tourism industry in Auvergne-Rhône-Alpes, France 2017, by service
- Premium Statistic Investments in the tourism industry in Auvergne-Rhône-Alpes, France, 2017
- Premium Statistic Average tourist expenditure per day and person in Auvergne-Rhône-Alpes, France 2018
- Premium Statistic Employment in the tourism industry in Auvergne-Rhône-Alpes, France, 2013-2017
- Premium Statistic Main tourist attractions in Auvergne-Rhône-Alpes, France, 2018
- Premium Statistic Secondary residences in Auvergne-Rhône-Alpes, France 2018
- Premium Statistic Nationality breakdown of foreign-owned holiday homes in Auvergne-Rhône-Alpes 2018
- Premium Statistic Airbnb tourist taxes contribution in Auvergne-Rhône-Alpes, France 2019, by department
Selected statistics
10
- Premium Statistic Revenue of Marriott International worldwide 1999-2022
- Premium Statistic Number of available rooms in Las Vegas 2000-2022
- Premium Statistic Hotel occupancy rate in Las Vegas 2001-2022
- Basic Statistic Number of Marriott International hotels worldwide 2009-2022
- Basic Statistic Operating income of Marriott International worldwide 2007-2022
- Basic Statistic Global occupancy rate of Marriott International hotels 2010-2022, by region
- Premium Statistic Number of Marriott International employees worldwide 2007-2022
- Basic Statistic Quarterly average daily rate of hotels in San Diego 2016-2017
- Basic Statistic Quarterly average daily rate in hotels in Washington D.C. 2016-2017
- Basic Statistic Quarterly average daily rate of hotels in Atlanta 2016-2017
Other regions
10
- Basic Statistic COVID-19 impact on overnight stays of foreign and domestic tourists in Finland 2022
- Premium Statistic Average number of nights spent in hotels in Estonia 2010-2021
- Premium Statistic Average length of stay in hotels in Hungary 2010-2021
- Premium Statistic Average length of hotel stay in Australia 2008-2013
- Premium Statistic Average daily rate (ADR) of hotels in Rome 2014-2019
- Premium Statistic Number of boat nights spent in guest harbors in Sweden 2018, by nationality
- Premium Statistic Average expenditure on accommodation and leisure Antwerp 2017-2018
- Premium Statistic Average length of stay in hotels in Belarus 2010-2021
- Premium Statistic Quarterly COVID-19 impact on revPAR in India 2020-2022
- Premium Statistic ADR of hotels in Oman 2019-2021
Related statistics
10
- Premium Statistic Overnight stays in Grand Est, France 2018, by type of accommodation
- Premium Statistic Overnight stays in Airbnb in Grand Est, France 2018, by city
- Premium Statistic Average daily rate (ADR) of hotels in Florence 2014-2019
- Premium Statistic Average daily rate (ADR) of hotels in Milan 2014-2019
- Premium Statistic Revenue per available room (RevPAR) of hotels in Venice 2014-2019
- Premium Statistic Revenue per available room (RevPAR) of hotels in Rome 2014-2019
- Premium Statistic Revenue per available room (RevPAR) of hotels in selected cities in Italy 2019
- Premium Statistic Revenue per available room (RevPAR) of hotels in Florence 2014-2019
- Premium Statistic YoY percentage change in RevPAR of hotels in selected cities in Italy 2018
- Premium Statistic Number of tourist beds in Grand Est, France 2018
Further related statistics
10
- Growth of inbound spending in the U.S. using foreign visa credit cards
- Countries with the highest number of inbound tourist arrivals worldwide 2019-2022
- Foreign exchange earnings from tourism in India 2000-2021
- Contribution of China's travel and tourism industry to GDP 2014-2023
- Change in number of visitors from Mexico to the U.S. 2018-2024
- Importance of BRICS countries to UK tourism businesses 2011
- Annual revenue of China Tourism Group Duty Free 2012-2022
- Countries with the highest outbound tourism expenditure worldwide 2019-2021
- Number of international tourist arrivals in India 2010-2021
- Leading countries in the MEA in the Travel & Tourism Competitiveness Index 2018
Further Content: You might find this interesting as well
Statistics
- Growth of inbound spending in the U.S. using foreign visa credit cards
- Countries with the highest number of inbound tourist arrivals worldwide 2019-2022
- Foreign exchange earnings from tourism in India 2000-2021
- Contribution of China's travel and tourism industry to GDP 2014-2023
- Change in number of visitors from Mexico to the U.S. 2018-2024
- Importance of BRICS countries to UK tourism businesses 2011
- Annual revenue of China Tourism Group Duty Free 2012-2022
- Countries with the highest outbound tourism expenditure worldwide 2019-2021
- Number of international tourist arrivals in India 2010-2021
- Leading countries in the MEA in the Travel & Tourism Competitiveness Index 2018
Auvergne-Rhône-Alpes Tourisme. (September 25, 2020). Number of nights spent in hotels in the Auvergne-Rhône-Alpes region in France from 2013 to 2019 (in million) [Graph]. In Statista. Retrieved October 02, 2023, from https://www.statista.com/statistics/1121983/number-hotels-overnight-stays-auvergne-rhone-alpes-france/
Auvergne-Rhône-Alpes Tourisme. "Number of nights spent in hotels in the Auvergne-Rhône-Alpes region in France from 2013 to 2019 (in million)." Chart. September 25, 2020. Statista. Accessed October 02, 2023. https://www.statista.com/statistics/1121983/number-hotels-overnight-stays-auvergne-rhone-alpes-france/
Auvergne-Rhône-Alpes Tourisme. (2020). Number of nights spent in hotels in the Auvergne-Rhône-Alpes region in France from 2013 to 2019 (in million). Statista. Statista Inc.. Accessed: October 02, 2023. https://www.statista.com/statistics/1121983/number-hotels-overnight-stays-auvergne-rhone-alpes-france/
Auvergne-Rhône-Alpes Tourisme. "Number of Nights Spent in Hotels in The Auvergne-rhône-alpes Region in France from 2013 to 2019 (in Million)." Statista, Statista Inc., 25 Sep 2020, https://www.statista.com/statistics/1121983/number-hotels-overnight-stays-auvergne-rhone-alpes-france/
Auvergne-Rhône-Alpes Tourisme, Number of nights spent in hotels in the Auvergne-Rhône-Alpes region in France from 2013 to 2019 (in million) Statista, https://www.statista.com/statistics/1121983/number-hotels-overnight-stays-auvergne-rhone-alpes-france/ (last visited October 02, 2023)
Number of nights spent in hotels in the Auvergne-Rhône-Alpes region in France from 2013 to 2019 (in million) [Graph], Auvergne-Rhône-Alpes Tourisme, September 25, 2020. [Online]. Available: https://www.statista.com/statistics/1121983/number-hotels-overnight-stays-auvergne-rhone-alpes-france/