


Dominique Petruzzi
Research expert covering Cosmetics, Personal Care, Health & Hygiene industries.
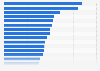
Get in touch with us nowFor the week ending on January 7 2024, the total demand for both edible goods and non-edible goods in drugstores in the Netherlands stood at 102 and 94, respectively. The demand index for both categories fluctuated in the time period considered.
You only have access to basic statistics.
This statistic is not included in your account.
Business Solutions including all features.
About the industry
About the region
Selected statistics
Other regions
Related statistics
Further related statistics


