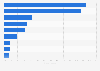
Global business tourism spending has seen year-over-year growth over the past decade. In 2019, expenditure rose by 2.6 percent over the previous year. Conversely, business travel spending worldwide recorded the most significant year-on-year drop in 2009, during the financial crisis, declining by 12.6 percent over 2008.
Year-on-year (YoY) percentage change in business tourism spending worldwide from 1995 to 2019
Loading statistic...
Basic Account
Get to know the platform
You only have access to basic statistics.
Single Account
The ideal entry-level account for individual users
- Instant access to 1m statistics
- Download in XLS, PDF & PNG format
- Detailed references
$59 $39 / Month *
in the first 12 months
Corporate Account
Full access
Corporate solution including all features.
* Prices do not include sales tax.
Further Content: You might find this interesting as well
Statistics
- Domestic business travel expenditure in Great Britain 2017-2019, by month
- Preferred assistance of French business travelers for their flight 2015-2016
- Inbound business travel spending in the United Kingdom (UK) Q1 2015-Q1 2020
- Average cost of U.S. international business trips Q3 2013-Q3 2019
- Global business travel spending 2015-2017
- Business trips taken by Italian travelers 2019, by transport and sector
- Share of overnight stays for domestic business trips in Italy 2019, by region
- Business travel spending of China 2013-2020
- Events hosted by the French Congress Centers 2014, by sector
- Annual growth in business travel spending in the U.S. 2010-2017
- Spending in Scotland by visitors from Great Britain 2015, by trip purpose
- Average length of business trips abroad by French people 2011-2017
- Change in animal species 1970-2014, by biogeographical realm
- Revenue of online gross travel bookings worldwide 2011-2017
- Value of the global savory snacks market 2019-2026
- Real education consumer spending per capita forecast in Northern Africa 2010-2025
- Service organizations making investments in mobile workers worldwide 2018
WTTC. (January 4, 2021). Year-on-year (YoY) percentage change in business tourism spending worldwide from 1995 to 2019 [Graph]. In Statista. Retrieved February 27, 2021, from https://www.statista.com/statistics/1194737/percentage-change-in-global-business-tourism-spending/
WTTC. "Year-on-year (YoY) percentage change in business tourism spending worldwide from 1995 to 2019." Chart. January 4, 2021. Statista. Accessed February 27, 2021. https://www.statista.com/statistics/1194737/percentage-change-in-global-business-tourism-spending/
WTTC. (2021). Year-on-year (YoY) percentage change in business tourism spending worldwide from 1995 to 2019. Statista. Statista Inc.. Accessed: February 27, 2021. https://www.statista.com/statistics/1194737/percentage-change-in-global-business-tourism-spending/
WTTC. "Year-on-year (Yoy) Percentage Change in Business Tourism Spending Worldwide from 1995 to 2019." Statista, Statista Inc., 4 Jan 2021, https://www.statista.com/statistics/1194737/percentage-change-in-global-business-tourism-spending/
WTTC, Year-on-year (YoY) percentage change in business tourism spending worldwide from 1995 to 2019 Statista, https://www.statista.com/statistics/1194737/percentage-change-in-global-business-tourism-spending/ (last visited February 27, 2021)